Gene expression profiling and network analysis reveals lipid and steroid metabolism to be the most favored by TNFalpha in HepG2 cells
- PMID: 20140224
- PMCID: PMC2816217
- DOI: 10.1371/journal.pone.0009063
Gene expression profiling and network analysis reveals lipid and steroid metabolism to be the most favored by TNFalpha in HepG2 cells
Abstract
Background: The proinflammatory cytokine, TNFalpha, is a crucial mediator of the pathogenesis of several diseases, more so in cases involving the liver wherein it is critical in maintaining liver homeostasis since it is a major determiner of hepatocyte life and death. Gene expression profiling serves as an appropriate strategy to unravel the underlying signatures to envisage such varied responses and considering this, gene transcription profiling was examined in control and TNFalpha treated HepG2 cells.
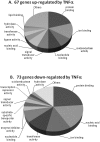
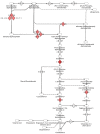
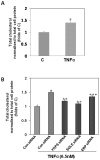
Methods and findings: Microarray experiments between control and TNFalpha treated HepG2 cells indicated that TNFalpha could significantly alter the expression profiling of 140 genes; among those up-regulated, several GO (Gene Ontology) terms related to lipid and fat metabolism were significantly (p<0.01) overrepresented indicating a global preference of fat metabolism within the hepatocyte and those within the down-regulated dataset included genes involved in several aspects of the immune response like immunoglobulin receptor activity and IgE binding thereby indicating a compromise in the immune defense mechanism(s). Conserved transcription factor binding sites were identified in identically clustered genes within a common GO term and SREBP-1 and FOXJ2 depicted increased occupation of their respective binding elements in the presence of TNFalpha. The interacting network of "lipid metabolism, small molecule biochemistry" was derived to be significantly overrepresented that correlated well with the top canonical pathway of "biosynthesis of steroids".
Conclusions: TNFalpha alters the transcriptome profiling within HepG2 cells with an interesting catalog of genes being affected and those involved in lipid and steroid metabolism to be the most favored. This study represents a composite analysis of the effects of TNFalpha in HepG2 cells that encompasses the altered transcriptome profiling, the functional analysis of the up- and down- regulated genes and the identification of conserved transcription factor binding sites. These could possibly determine TNFalpha mediated alterations mainly the phenotypes of hepatic steatosis and fatty liver associated with several hepatic pathological states.
Conflict of interest statement
Figures


Similar articles
-
The expression profiling and ontology analysis of non-coding RNAs in dexamethasone induced steatosis in hepatoma cell.Gene. 2018 Apr 15;650:19-26. doi: 10.1016/j.gene.2018.01.089. Epub 2018 Feb 1. Gene. 2018. PMID: 29409992
-
Microarray analysis provides new insights into the function of apolipoprotein O in HepG2 cell line.Lipids Health Dis. 2013 Dec 17;12:186. doi: 10.1186/1476-511X-12-186. Lipids Health Dis. 2013. PMID: 24341743 Free PMC article.
-
Profiling of promoter occupancy by the SND1 transcriptional coactivator identifies downstream glycerolipid metabolic genes involved in TNFα response in human hepatoma cells.Nucleic Acids Res. 2015 Dec 15;43(22):10673-88. doi: 10.1093/nar/gkv858. Epub 2015 Aug 31. Nucleic Acids Res. 2015. PMID: 26323317 Free PMC article.
-
Transcriptome profiling of the feeding-to-fasting transition in chicken liver.BMC Genomics. 2008 Dec 17;9:611. doi: 10.1186/1471-2164-9-611. BMC Genomics. 2008. PMID: 19091074 Free PMC article.
-
Altered expression patterns of lipid metabolism genes in an animal model of HCV core-related, nonobese, modest hepatic steatosis.BMC Genomics. 2008 Feb 29;9:109. doi: 10.1186/1471-2164-9-109. BMC Genomics. 2008. PMID: 18307821 Free PMC article.
Cited by
-
Kuppfer cells trigger nonalcoholic steatohepatitis development in diet-induced mouse model through tumor necrosis factor-α production.J Biol Chem. 2012 Nov 23;287(48):40161-72. doi: 10.1074/jbc.M112.417014. Epub 2012 Oct 12. J Biol Chem. 2012. PMID: 23066023 Free PMC article.
-
Identification and analysis of hub genes and networks related to hypoxia preconditioning in mice (No 035215).Oncotarget. 2017 Dec 21;9(15):11889-11904. doi: 10.18632/oncotarget.23555. eCollection 2018 Feb 23. Oncotarget. 2017. PMID: 29552280 Free PMC article.
-
Ontogeny and polarization of macrophages in inflammation: blood monocytes versus tissue macrophages.Front Immunol. 2015 Jan 22;5:683. doi: 10.3389/fimmu.2014.00683. eCollection 2014. Front Immunol. 2015. PMID: 25657646 Free PMC article. Review.
-
Roles of AMPA receptors in social behaviors.Front Synaptic Neurosci. 2024 Jul 11;16:1405510. doi: 10.3389/fnsyn.2024.1405510. eCollection 2024. Front Synaptic Neurosci. 2024. PMID: 39056071 Free PMC article. Review.
-
Transcriptome profiling identifies p53 as a key player during calreticulin deficiency: Implications in lipid accumulation.Cell Cycle. 2015;14(14):2274-84. doi: 10.1080/15384101.2015.1046654. Epub 2015 May 6. Cell Cycle. 2015. PMID: 25946468 Free PMC article.
References
-
- Sato S, Sanjo H, Takeda K, Ninomiya-Tsuji J, Yamamoto M, et al. Essential function for the kinase TAK1 in innate and adaptive immune responses. Nat Immunol. 2005;6:1087–1095. - PubMed
-
- Wang C, Deng L, Hong M, Akkaraju GR, Inoue J, et al. TAK1 is a ubiquitin-dependent kinase of MKK and IKK. Nature. 2001;412:346–351. - PubMed
-
- Li YP, Reid MB. Effect of tumor necrosis factor-alpha on skeletal muscle metabolism. Curr Opin Rheumatol. 2001;13:483–487. - PubMed
-
- Pantelidis P, Fanning GC, Wells AU, Welsh KI, Du Bois RM. Analysis of tumor necrosis factor-alpha, lymphotoxin-alpha, tumor necrosis factor receptor II, and interleukin-6 polymorphisms in patients with idiopathic pulmonary fibrosis. Am J Respir Crit Care Med. 2001;163:1432–1436. - PubMed
Publication types
MeSH terms
Substances
Associated data
- Actions
LinkOut - more resources
Full Text Sources
Other Literature Sources
Molecular Biology Databases

