. 2010 Feb 5;6(2):e1000796.
doi: 10.1371/journal.pgen.1000796.

Genomic hotspots for adaptation: the population genetics of Müllerian mimicry in Heliconius erato

Affiliations

Genomic hotspots for adaptation: the population genetics of Müllerian mimicry in Heliconius erato

Brian A Counterman et al. PLoS Genet. .

Abstract

Wing pattern evolution in Heliconius butterflies provides some of the most striking examples of adaptation by natural selection. The genes controlling pattern variation are classic examples of Mendelian loci of large effect, where allelic variation causes large and discrete phenotypic changes and is responsible for both convergent and highly divergent wing pattern evolution across the genus. We characterize nucleotide variation, genotype-by-phenotype associations, linkage disequilibrium (LD), and candidate gene expression patterns across two unlinked genomic intervals that control yellow and red wing pattern variation among mimetic forms of Heliconius erato. Despite very strong natural selection on color pattern, we see neither a strong reduction in genetic diversity nor evidence for extended LD across either patterning interval. This observation highlights the extent that recombination can erase the signature of selection in natural populations and is consistent with the hypothesis that either the adaptive radiation or the alleles controlling it are quite old. However, across both patterning intervals we identified SNPs clustered in several coding regions that were strongly associated with color pattern phenotype. Interestingly, coding regions with associated SNPs were widely separated, suggesting that color pattern alleles may be composed of multiple functional sites, conforming to previous descriptions of these loci as "supergenes." Examination of gene expression levels of genes flanking these regions in both H. erato and its co-mimic, H. melpomene, implicate a gene with high sequence similarity to a kinesin as playing a key role in modulating pattern and provides convincing evidence for parallel changes in gene regulation across co-mimetic lineages. The complex genetic architecture at these color pattern loci stands in marked contrast to the single casual mutations often identified in genetic studies of adaptation, but may be more indicative of the type of genetic changes responsible for much of the adaptive variation found in natural populations.


Conflict of interest statement

The authors have declared that no competing interests exist.

Figures

Figure 1
Figure 1. Sampling sites across the transition between H. e. favorinus and H. e. emma.
Geographic representation of the five locations where H. erato was sampled across the Eastern Peruvian hybrid zone. Dotted line is approximate location of the Tarapoto-Yurimaguas road that transects the hybrid zone and was used for sampling. The D locus affects the presence of the proximal red patch (“dennis”), red hindwing rays and the forewing band color. The Cr locus is responsible for the presence of the hindwing yellow bar and interacts with the Sd locus to affect the shape of the forewing band and hindwing bar.
Figure 2
Figure 2. BAC tile paths and fine mapping across the D and Cr color pattern intervals.
Individual BAC clones tiling across the color pattern intervals are represented by horizontal shaded bars, with clone name provided directly below. Black horizontal bar above BAC tile path represents consensus sequence assembled from overlapping BACs. Slashes indicate gaps in the consensus sequence across the interval. There were two small gaps (≈10kb between H. erato clone 33L14 and 18A1 and ≈5kb between 38G06 and 47M12) and one large gap (≈250 kb) in our assembly based on comparisons to Bombyx mori and H. melpomene. For the Cr interval, the grey horizontal bar extending to the right of the black horizontal bar represents a region with no available information on recombination. Vertical white markers denote approximate positions of genetic markers used for brood mapping, with marker names stated directly above. Below each marker is the number of individuals showing a recombination event between the genetic marker and color pattern phenotype over the total number of individuals genotyped. For the D locus, four phenotypically distinct races of H. erato were used for fine mapping in crosses with H. himera ,,and the results for each race are provided separately. Genetic markers designated NA were either not polymorphic or could not be reliably scored in the corresponding crosses. Shaded areas denote approximate locations of ‘zero recombinant intervals’.
Figure 3
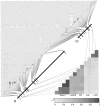
Figure 3. Lack of LD between SNPs across the D and Cr intervals in the Peruvian hybrid zone.
Correlation matrix of composite LD estimates among SNPs from the 22 coding regions sampled across the D and Cr intervals using all 76 individuals. SNPs are concatenated by their position along the D and Cr intervals. The upper left matrix shows LD between the 401 SNPs sampled across the D and Cr intervals. The lower right matrix only shows SNPs from the D and Cr intervals that are strongly associated with wing color pattern.
Figure 4
Figure 4. Several sites in multiple coding regions are associated with the transition in D and Cr color patterns.
Plot of genotype-phenotype associations (black circles) and population differentiation (red squares) across the D, Cr and unlinked intervals. The left axis is the strength of associations (log10 of the probability of a genotype-by-phenotype association) between genotypes and color patterns. The right axis measures degree of population differentiation, measured as FST, between H. e. favorinus and H. e. emma. Distance across the genomic intervals is in kilobases. Points above the horizontal show a significant genotype-by-phenotype association using a bonferroni correction to adjust for multiple tests (α = 0.05, n = 432).
Figure 5
Figure 5. Quantitative PCR of D-interval candidate genes implicates kinesin.
Quantitative PCR data for five candidate genes in the D-interval. Y-axis values are Log2 transformed values of the initial concentration of the gene divided by the EF-1α initial concentration; developmental stage is displayed on the X axis, including 5th instar larvae and pupal developmental days 1, 3, and 5. Bars represent standard error among the biological replicates.

References

    1. Barrett RDH, Schluter D. Adaptation from standing genetic variation. Trends in Ecology & Evolution. 2008;23:38–44. - PubMed
    1. Colosimo PF, Hosemann KE, Balabhadra S, Villareal G, Dickson M, et al. Widespread parallel evolution in sticklebacks by repeated fixation of Ectodyplasin alleles. Science. 2005;307:1928–1933. - PubMed
    1. Werner JD, Borevitz JO, Warthmann N, Trainer GT, Ecker JR, et al. Quantitative trait locus mapping and DNA array hybridization identify an FLM deletion as a cause for natural flowering-time variation. Proceedings of the National Academy of Sciences of the United States of America. 2005;102:2460–2465. - PMC - PubMed
    1. Tishkoff SA, Reed FA, Ranciaro A, Voight BF, Babbitt CC, et al. Convergent adaptation of human lactase persistence in Africa and Europe. Nature Genetics. 2007;39–40:31. - PMC - PubMed
    1. Steiner CC, Weber JN, Hoekstra HE. Adaptive variation in beach mice produced by two interacting pigmentation genes. PLoS Biol. 2007;5:e219. doi: 10.1371/journal.pbio.0050219. - DOI - PMC - PubMed

Publication types