. 2010 Feb 3;5(2):e8433.
doi: 10.1371/journal.pone.0008433.

Genetically-defined deficiency of mannose-binding lectin is associated with protection after experimental stroke in mice and outcome in human stroke

Affiliations

Genetically-defined deficiency of mannose-binding lectin is associated with protection after experimental stroke in mice and outcome in human stroke

Alvaro Cervera et al. PLoS One. .

Abstract

Background: The complement system is a major effector of innate immunity that has been involved in stroke brain damage. Complement activation occurs through the classical, alternative and lectin pathways. The latter is initiated by mannose-binding lectin (MBL) and MBL-associated serine proteases (MASPs). Here we investigated whether the lectin pathway contributes to stroke outcome in mice and humans.

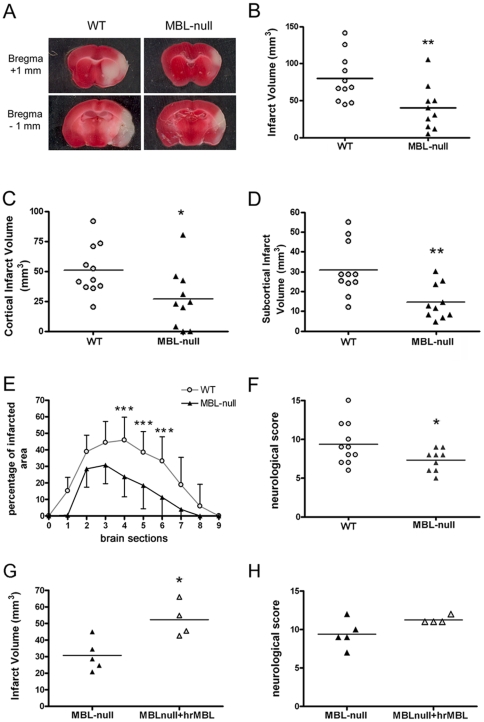
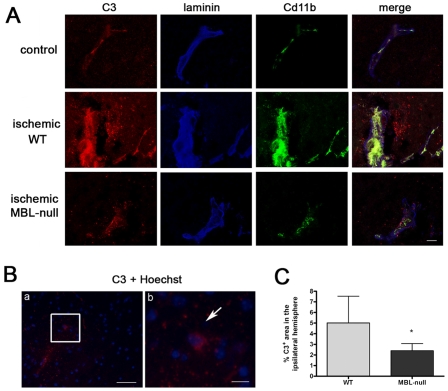
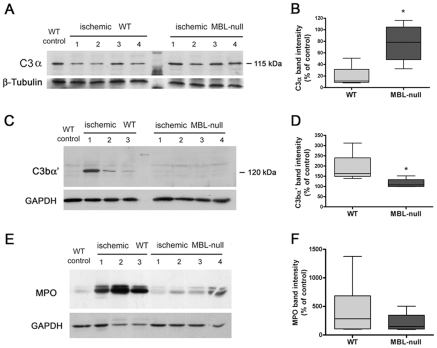
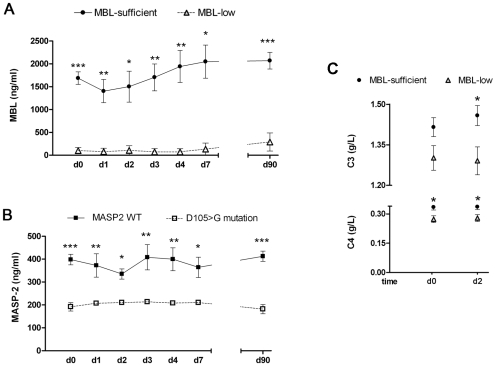
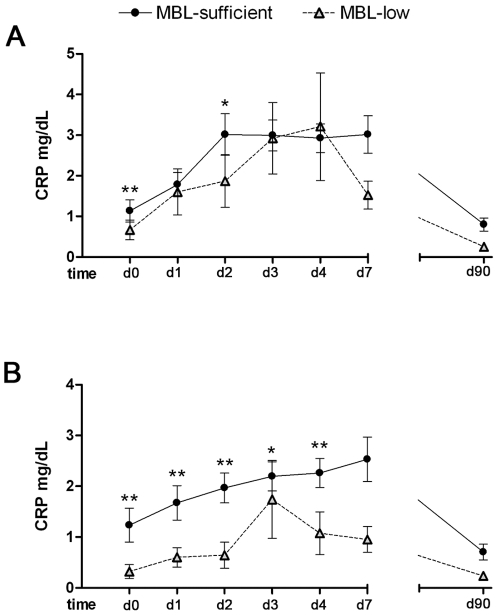
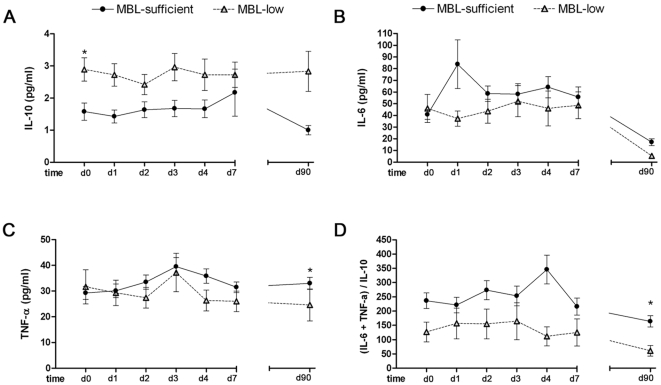
Methodology/principal findings: Focal cerebral ischemia/reperfusion in MBL-null mice induced smaller infarctions, better functional outcome, and diminished C3 deposition and neutrophil infiltration than in wild-type mice. Accordingly, reconstitution of MBL-null mice with recombinant human MBL (rhMBL) enhanced brain damage. In order to investigate the clinical relevance of these experimental observations, a study of MBL2 and MASP-2 gene polymorphism rendering the lectin pathway dysfunctional was performed in 135 stroke patients. In logistic regression adjusted for age, gender and initial stroke severity, unfavourable outcome at 3 months was associated with MBL-sufficient genotype (OR 10.85, p = 0.008) and circulating MBL levels (OR 1.29, p = 0.04). Individuals carrying MBL-low genotypes (17.8%) had lower C3, C4, and CRP levels, and the proinflammatory cytokine profile was attenuated versus MBL-sufficient genotypes.

Conclusions/significance: In conclusion, genetically defined MBL-deficiency is associated with a better outcome after acute stroke in mice and humans.


Conflict of interest statement

Competing Interests: The authors have declared that no competing interests exist.

Figures

Figure 1
Figure 1. MBL-null mice develop smaller infarct volumes than wild-type mice.
A) Representative images of infarcted brain tissue in wild-type (WT) and MBL-null mice at 48 h post-ischemia. The approximate level of the brain sections is indicated in the left by the distance from Bregma. B) Infarct volume was lesser in the MBL-null group (n = 11) than in WT (n = 10). C) Cortical and D) subcortical infarct volumes were smaller in MBL-null than in WT mice. E) The percentage of tissue with infarction per brain section (1 mm-thick) is shown for consecutive sections, starting (left) from the frontal part of the brain. The proportion of infarcted tissue is smaller in MBL-null than in WT mice. Values are expressed as the mean±SD. Two-way ANOVA by genotype and brain section showed significant differences due to genotype (p<0.001, F(9,40) = 18.74). Post-hoc Bonferroni test showed significant differences in the indicated brain sections. F) The neurological score was better (lower) in MBL-null mice than in WT. (G–H) MBL-null mice were treated with rhMBL (MBLnull+rhMBL) (n = 4) or vehicle (MBLnull) (n = 5). G) MBL-null mice receiving rhMBL showed larger infarct volume than non-reconstituted mice. H) A trend to worst neurological deficit (p = 0.09) was seen after reconstitution with rhMBL compared to vehicle. Symbols indicate values for individual animals. * p<0.05, ** p<0.01, *** p<0.001).
Figure 2
Figure 2. Ischemia-induced C3 deposition in brain parenchyma is attenuated in MBL-null versus WT mice.
A) C3 deposition (red), laminin immunostaining (blue), and CD11b (green). C3 immunoreaction is often associated to vessels and it is also found within the ischemic brain parenchyma. The C3 reaction is more moderate in MBL-null mice than in the WT. Control indicates non-operated WT mice. Bar scale  = 10 µm. B) C3 deposition (red) and Hoechst counterstaining to illustrate the cell nuclei shows C3 immunoreaction surrounding certain cell bodies (arrow in b). (b) is a magnification of the square shown in (a). C) Quantification of the C3 immunoreactive area in the ipsilateral hemisphere shows a significant reduction in MBL-null mice (n = 5) versus the WT (n = 5). Values are expressed as the mean±SD. Bar scale: (a) 100 µm, (b) 10 µm. * indicates p<0.05.
Figure 3
Figure 3. C3 activation and neutrophil infiltration in the ischemic brain is lower in MBL-null than WT mice.
A) C3 α-chain is observed in control tissue with a rabbit anti-mouse C3 antibody. C3 is cleaved after ischemia in WT mice and, to a lesser extent, in MBL-null mice. Lanes represent different animals. B) Quantification of band optical density shows more severe cleavage of the C3 α-chain in WT than in MBL-null mice. C) The C3bα' fragment (120 kDa) is evidenced in the ischemic tissue with an anti-C3 antibody. D) Quantification of band optical density shows that C3bα' is more abundant in the ischemic tissue of WT than of MBL-null mice. E) Myeloperoxidase (MPO) is a marker of neutrophil infiltration in brain tissue. MPO is detected in the ischemic brain of WT mice, while it is attenuated in MBL-KO mice, as shown in F). Values are expressed as mean±SD. * p<0.05.
Figure 4
Figure 4. Serum levels of MBL and MASP-2 and complement system activation according to MBL2 and MASP2 genotypes.
A) Serum concentrations (ng/ml) of MBL in MBL-low genotypes and MBL-sufficient genotypes. B) Serum concentrations (ng/ml) of MASP-2 in patients with D105>G or wild-type MASP2 genotypes. Measurements were performed at day 0 (d0) (n = 96), day 1 (d1) (n = 10), day 2 (d2) (n = 7), day 3 (d3) (n = 10), day 4 (d4) (n = 10), day 7 (d7) (n = 9) and day 90 (d90) (n = 96). C) Serum concentration (g/L) of C3 and C4 at day 0 (d0) (n = 96) and day 2 (d2) (n = 96). Values are the mean ±SD. *p<0.05; **p<0.01; ***p<0.0001.
Figure 5
Figure 5. C-reactive protein levels (mg/dL) in MBL-low genotypes and MBL-sufficient genotypes.
A) All patients, day 0 (d0) baseline (n = 127; MBL-low = 23, MBL-sufficient = 104); day 1 (d1) (n = 131; MBL-low = 24, MBL-sufficient = 107); day 2 (d2) (n = 132; MBL-low = 24, MBL-sufficient = 108); day 3 (d3) (n = 127; MBL-low = 24, MBL-sufficient = 103); day 4 (d4) (n = 122; MBL-low = 22, MBL-sufficient = 100), day 7 (d7) (n = 111; MBL-low = 19, MBL-sufficient = 92), and day 90 (d90) (n = 68; MBL-low = 12, MBL-sufficient = 56). B) Patients without post-stroke infections, d0 (n = 103; MBL-low = 18, MBL-sufficient = 85); d1 (n = 107; MBL-low = 19, MBL-sufficient = 88); d2 (n = 108; MBL-low = 19, MBL-sufficient = 89); d3 (n = 105; MBL-low = 19, MBL-sufficient = 86); d4 (n = 101; MBL-low = 17, MBL-sufficient = 84), d7 (n = 91; MBL-low = 15, MBL-sufficient = 76), and d90 (n = 60; MBL-low = 11, MBL-sufficient = 49). Values were obtained from serum and are expressed as the mean ± SD. * p<0.05, ** p = 0.01. *p<0.05, **p = 0.01.
Figure 6
Figure 6. Cytokine levels (pg/ml) in blood in MBL-low genotypes and MBL-sufficient genotypes.
A) Interleukin-10; B) Interleukin-6; C) TNF-α; D) Balance between T helper (h) 1 cytokines and Th2 cytokines calculated as (TNF-α + IL-6)/IL-10. Measurements were performed in serum samples at day 0 (d0) (n = 129; MBL-low = 23, MBL-sufficient = 106); day1 (d1) (n = 121; MBL-low = 22, MBL-sufficient = 99); day 2 (d2) (n = 122; MBL-low = 22, MBL-sufficient = 100); day 3 (d3) (n = 116; MBL-low = 19, MBL-sufficient = 97); day 4 (d4) (n = 111; MBL-low = 16, MBL-sufficient = 95), day 7 (d7) (n = 101; MBL-low = 16, MBL-sufficient = 85), and day 90 (d90) (n = 92; MBL-low = 15, MBL-sufficient = 77). Values are the mean ± SD. *p<0.05, **p<0.01.

Similar articles

Cited by

References

    1. Carroll MC, Holers VM. Innate autoimmunity. Adv Immunol. 2005;86:37–57. - PubMed
    1. van Beek J, Elward K, Gasque P. Activation of complement in the central nervous system: roles in neurodegeneration and neuroprotection. Ann N Y Acad Sci. 2003;992:56–71. - PubMed
    1. Mocco J, Wilson DA, Komotar RJ, Sughrue ME, Coates K, et al. Alterations in plasma complement levels after human ischemic stroke. Neurosurgery. 2006;59:28–33. - PubMed
    1. Lindsberg PJ, Ohman J, Lehto T, Karjalainen-Lindsberg ML, Paetau A, et al. Complement activation in the central nervous system following blood-brain barrier damage in man. Ann Neurol. 1996;40:587–596. - PubMed
    1. Frank MM, Fries LF. The role of complement in inflammation and phagocytosis. Immunol Today. 1991;12:322–326. - PubMed

Publication types

MeSH terms