

Lack of sik1 in mouse embryonic stem cells impairs cardiomyogenesis by down-regulating the cyclin-dependent kinase inhibitor p57kip2
- PMID: 20140255
- PMCID: PMC2815785
- DOI: 10.1371/journal.pone.0009029
Lack of sik1 in mouse embryonic stem cells impairs cardiomyogenesis by down-regulating the cyclin-dependent kinase inhibitor p57kip2
Abstract
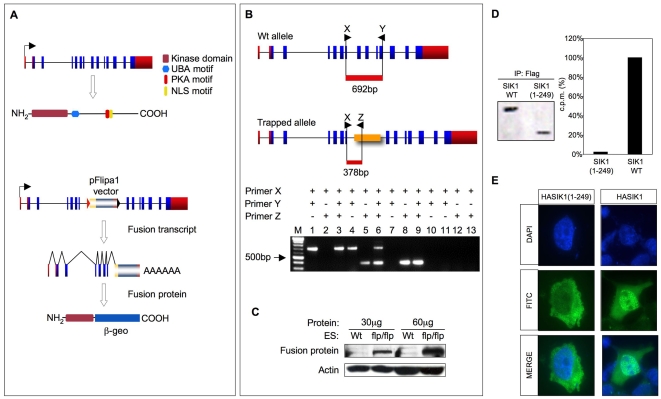
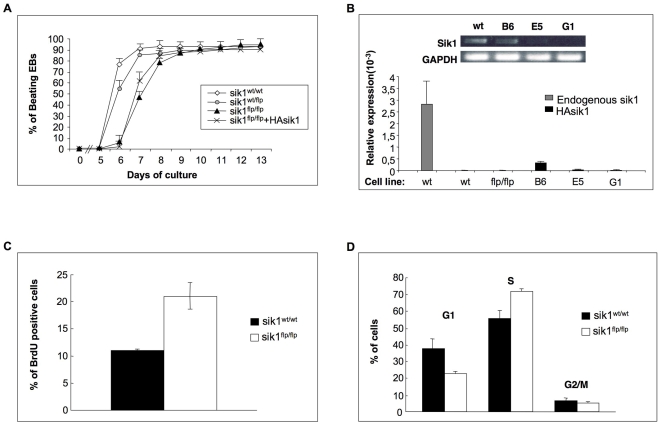
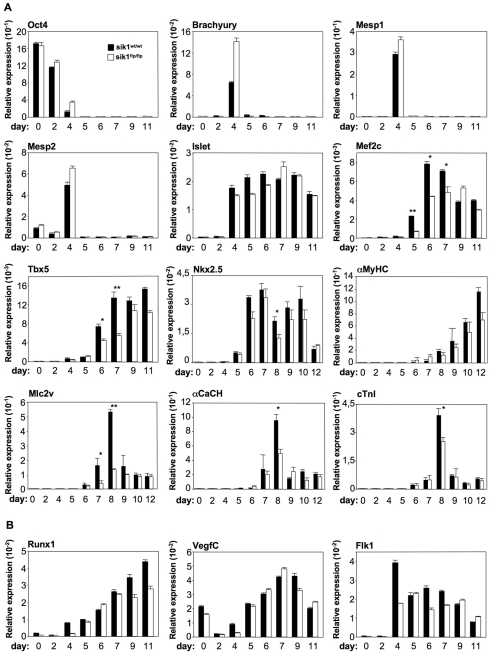
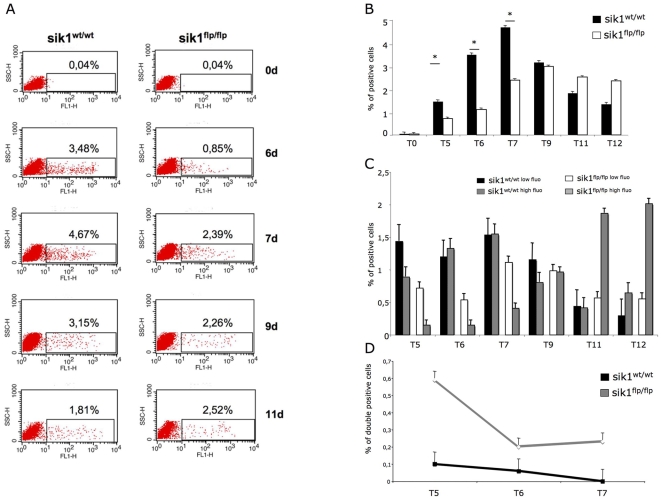
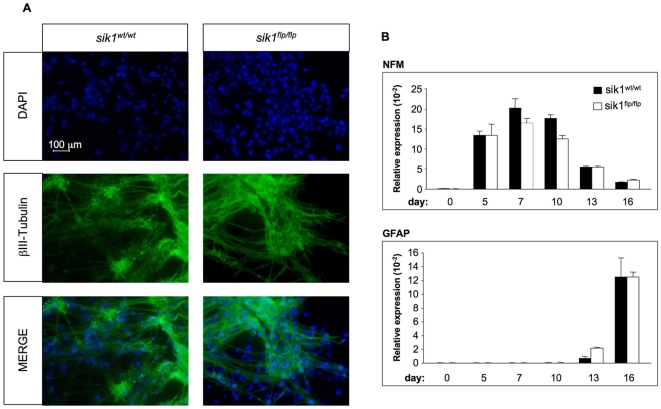
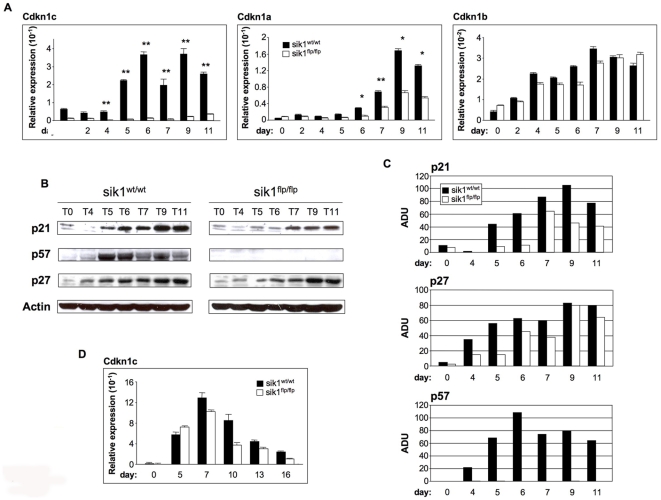
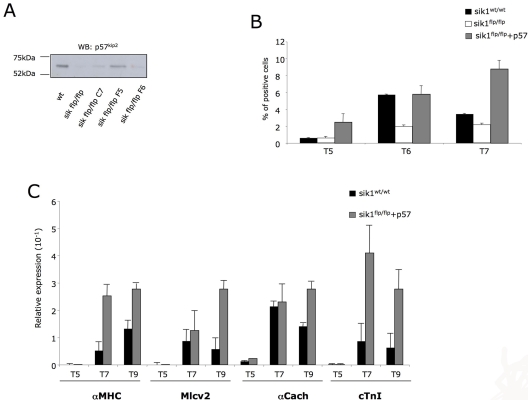
Sik1 (salt inducible kinase 1) is a serine/threonine kinase that belongs to the stress- and energy-sensing AMP-activated protein kinase family. During murine embryogenesis, sik1 marks the monolayer of future myocardial cells that will populate first the primitive ventricle, and later the primitive atrium suggesting its involvement in cardiac cell differentiation and/or heart development. Despite that observation, the involvement of sik1 in cardiac differentiation is still unknown. We examined the sik1 function during cardiomyocyte differentiation using the ES-derived embryoid bodies. We produced a null embryonic stem cell using a gene-trap cell line carrying an insertion in the sik1 locus. In absence of the sik1 protein, the temporal appearance of cardiomyocytes is delayed. Expression profile analysis revealed sik1 as part of a genetic network that controls the cell cycle, where the cyclin-dependent kinase inhibitor p57(Kip2) is directly involved. Collectively, we provided evidence that sik1-mediated effects are specific for cardiomyogenesis regulating cardiomyoblast cell cycle exit toward terminal differentiation.
Conflict of interest statement
Figures
Similar articles
-
P21-activated kinase 4 regulates the cyclin-dependent kinase inhibitor p57(kip2) in human breast cancer.Anat Rec (Hoboken). 2013 Oct;296(10):1561-7. doi: 10.1002/ar.22754. Epub 2013 Jul 19. Anat Rec (Hoboken). 2013. PMID: 23873832
-
MicroRNA-221 is required for proliferation of mouse embryonic stem cells via P57 targeting.Stem Cell Rev Rep. 2015 Feb;11(1):39-49. doi: 10.1007/s12015-014-9543-y. Stem Cell Rev Rep. 2015. PMID: 25086570
-
The cyclin-dependent kinase inhibitor p57Kip2 regulates cell cycle exit, differentiation, and migration of embryonic cerebral cortical precursors.Cereb Cortex. 2011 Aug;21(8):1840-56. doi: 10.1093/cercor/bhq254. Epub 2011 Jan 18. Cereb Cortex. 2011. PMID: 21245411 Free PMC article.
-
p57KIP2: "Kip"ing the cell under control.Mol Cancer Res. 2009 Dec;7(12):1902-19. doi: 10.1158/1541-7786.MCR-09-0317. Epub 2009 Nov 24. Mol Cancer Res. 2009. PMID: 19934273 Review.
-
Genetic and Epigenetic Control of CDKN1C Expression: Importance in Cell Commitment and Differentiation, Tissue Homeostasis and Human Diseases.Int J Mol Sci. 2018 Apr 2;19(4):1055. doi: 10.3390/ijms19041055. Int J Mol Sci. 2018. PMID: 29614816 Free PMC article. Review.
Cited by
-
Elucidating Compound Mechanism of Action by Network Perturbation Analysis.Cell. 2015 Jul 16;162(2):441-451. doi: 10.1016/j.cell.2015.05.056. Cell. 2015. PMID: 26186195 Free PMC article.
-
Extensive natural variation for cellular hydrogen peroxide release is genetically controlled.PLoS One. 2012;7(8):e43566. doi: 10.1371/journal.pone.0043566. Epub 2012 Aug 29. PLoS One. 2012. PMID: 22952707 Free PMC article.
-
Loss of the AE3 anion exchanger in a hypertrophic cardiomyopathy model causes rapid decompensation and heart failure.J Mol Cell Cardiol. 2011 Jan;50(1):137-46. doi: 10.1016/j.yjmcc.2010.10.028. Epub 2010 Nov 4. J Mol Cell Cardiol. 2011. PMID: 21056571 Free PMC article.
-
LKB1 signaling in advancing cell differentiation.Fam Cancer. 2011 Sep;10(3):425-35. doi: 10.1007/s10689-011-9441-2. Fam Cancer. 2011. PMID: 21519908 Review.
-
Transcriptional induction of salt-inducible kinase 1 by transforming growth factor β leads to negative regulation of type I receptor signaling in cooperation with the Smurf2 ubiquitin ligase.J Biol Chem. 2012 Apr 13;287(16):12867-78. doi: 10.1074/jbc.M111.307249. Epub 2012 Feb 29. J Biol Chem. 2012. PMID: 22378783 Free PMC article.
References
-
- Srivastava D, Olson EN. A genetic blueprint for cardiac development. Nature. 2000;407:221–226. - PubMed
-
- Lints TJ, Parsons LM, Hartley L, Lyons I, Harvey RP. Nkx-2.5: a novel murine homeobox gene expressed in early heart progenitor cells and their myogenic descendants. Development. 1993;119:969. - PubMed
-
- Asakura A, Lyons GE, Tapscott SJ. The regulation of MyoD gene expression: conserved elements mediate expression in embryonic axial muscle. Dev Biol. 1995;171:386–398. - PubMed
-
- Griffin KJ, Stoller J, Gibson M, Chen S, Yelon D, et al. A conserved role for H15-related T-box transcription factors in zebrafish and Drosophila heart formation. Dev Biol. 2000;218:235–247. - PubMed
-
- Srivastava D, Cserjesi P, Olson EN. A subclass of bHLH proteins required for cardiac morphogenesis. Science. 1995;270:1995–1999. - PubMed
Publication types
MeSH terms
Substances
Grants and funding
LinkOut - more resources
Full Text Sources
Molecular Biology Databases
