Novelty encoding by the output neurons of the Basal Ganglia
- PMID: 20140267
- PMCID: PMC2816172
- DOI: 10.3389/neuro.06.020.2009
Novelty encoding by the output neurons of the Basal Ganglia
Abstract
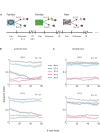
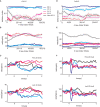
Reinforcement learning models of the basal ganglia have focused on the resemblance of the dopamine signal to the temporal difference error. However the role of the network as a whole is still elusive, in particular whether the output of the basal ganglia encodes only the behavior (actions) or it is part of the valuation process. We trained a monkey extensively on a probabilistic conditional task with seven fractal cues predicting rewarding or aversive outcomes (familiar cues). Then in each recording session we added a cue that the monkey had never seen before (new cue) and recorded from single units in the Substantia Nigra pars reticulata (SNpr) while the monkey was engaged in a task with new cues intermingled within the familiar ones. The monkey learned the association between the new cue and outcome and modified its licking and blinking behavior which became similar to responses to the familiar cues with the same outcome. However, the responses of many SNpr neurons to the new cue exceeded their response to familiar cues even after behavioral learning was completed. This dissociation between behavior and neural activity suggests that the BG output code goes beyond instruction or gating of behavior to encoding of novel cues. Thus, BG output can enable learning at the levels of its target neural networks.
Keywords: primate; reinforcement learning; spikes; substantia nigra pars reticulata.
Figures


Similar articles
-
Encoding of probabilistic rewarding and aversive events by pallidal and nigral neurons.J Neurophysiol. 2009 Feb;101(2):758-72. doi: 10.1152/jn.90764.2008. Epub 2008 Dec 3. J Neurophysiol. 2009. PMID: 19052110
-
Behavior-related modulation of substantia nigra pars reticulata neurons in rats performing a conditioned reinforcement task.Neuroscience. 2002;111(2):337-49. doi: 10.1016/s0306-4522(02)00018-0. Neuroscience. 2002. PMID: 11983319
-
Neurons gating behavior-developmental, molecular and functional features of neurons in the Substantia Nigra pars reticulata.Front Neurosci. 2022 Sep 6;16:976209. doi: 10.3389/fnins.2022.976209. eCollection 2022. Front Neurosci. 2022. PMID: 36148148 Free PMC article.
-
The pars reticulata of the substantia nigra: a window to basal ganglia output.Prog Brain Res. 2007;160:151-72. doi: 10.1016/S0079-6123(06)60009-5. Prog Brain Res. 2007. PMID: 17499113 Review.
-
Involvement of basal ganglia transmitter systems in movement initiation.Prog Neurobiol. 1998 Dec;56(5):507-40. doi: 10.1016/s0301-0082(98)00041-0. Prog Neurobiol. 1998. PMID: 9775402 Review.
Cited by
-
Asymmetric right/left encoding of emotions in the human subthalamic nucleus.Front Syst Neurosci. 2013 Oct 29;7:69. doi: 10.3389/fnsys.2013.00069. eCollection 2013. Front Syst Neurosci. 2013. PMID: 24194703 Free PMC article.
-
Encoding of eye movements explains reward-related activity in cerebellar simple spikes.J Neurophysiol. 2020 Feb 1;123(2):786-799. doi: 10.1152/jn.00363.2019. Epub 2020 Jan 15. J Neurophysiol. 2020. PMID: 31940216 Free PMC article.
-
Differences in Prediction May Underlie Language Disorder in Autism.Front Psychol. 2022 Jun 9;13:897187. doi: 10.3389/fpsyg.2022.897187. eCollection 2022. Front Psychol. 2022. PMID: 35756305 Free PMC article.
-
Autism as a disorder of prediction.Proc Natl Acad Sci U S A. 2014 Oct 21;111(42):15220-5. doi: 10.1073/pnas.1416797111. Epub 2014 Oct 6. Proc Natl Acad Sci U S A. 2014. PMID: 25288765 Free PMC article.
-
Curiosity: primate neural circuits for novelty and information seeking.Nat Rev Neurosci. 2024 Mar;25(3):195-208. doi: 10.1038/s41583-023-00784-9. Epub 2024 Jan 23. Nat Rev Neurosci. 2024. PMID: 38263217 Review.
References
LinkOut - more resources
Full Text Sources
Miscellaneous

