

Levodopa deactivates enzymes that regulate thiol-disulfide homeostasis and promotes neuronal cell death: implications for therapy of Parkinson's disease
- PMID: 20141169
- PMCID: PMC3201939
- DOI: 10.1021/bi9018658
Levodopa deactivates enzymes that regulate thiol-disulfide homeostasis and promotes neuronal cell death: implications for therapy of Parkinson's disease
Abstract
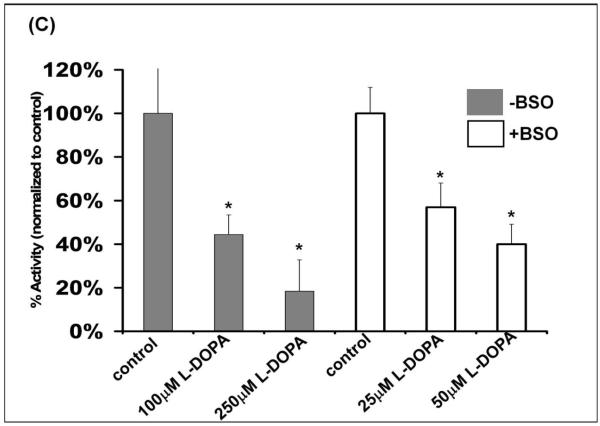
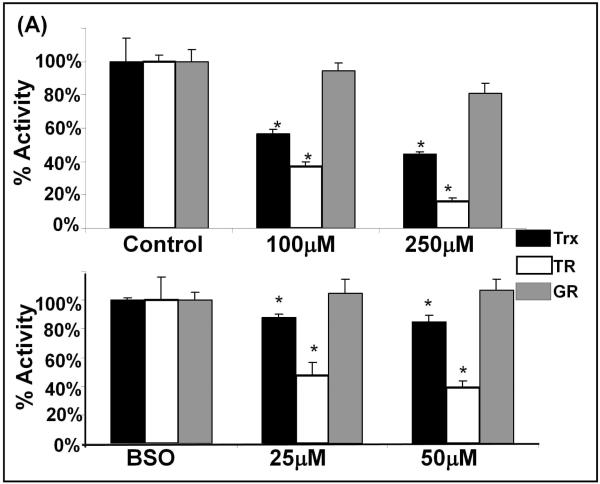
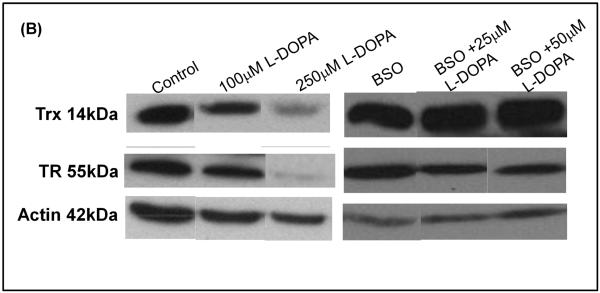
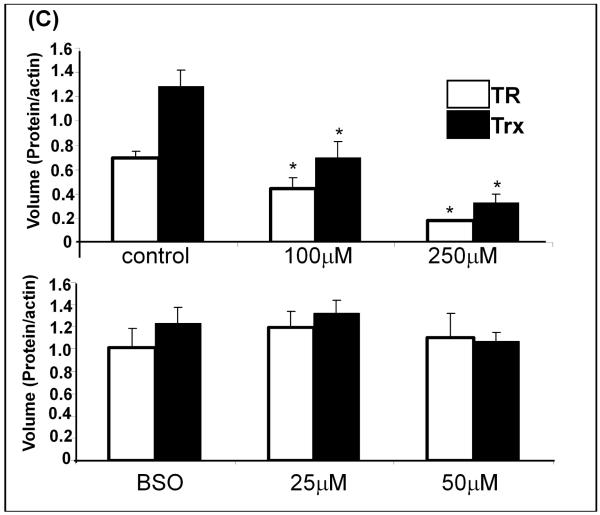
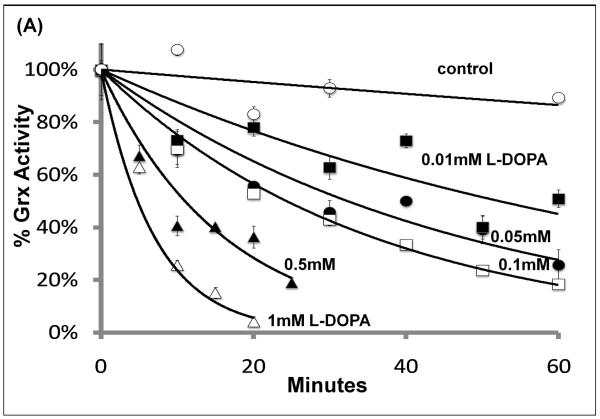
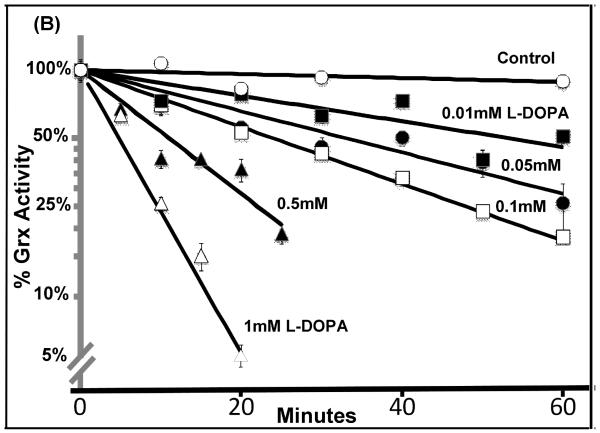
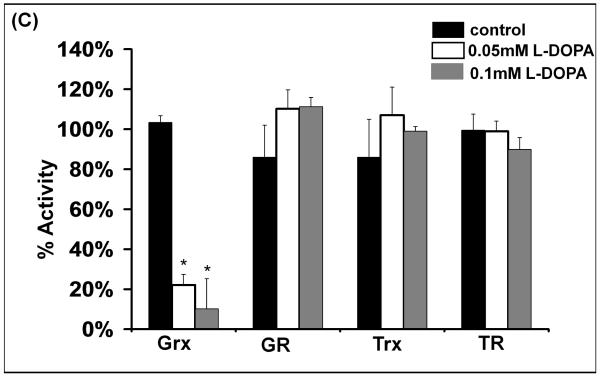
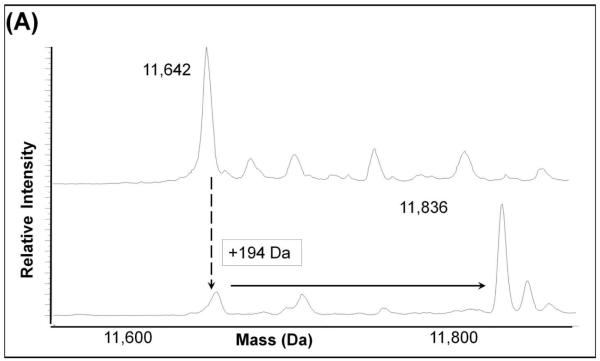
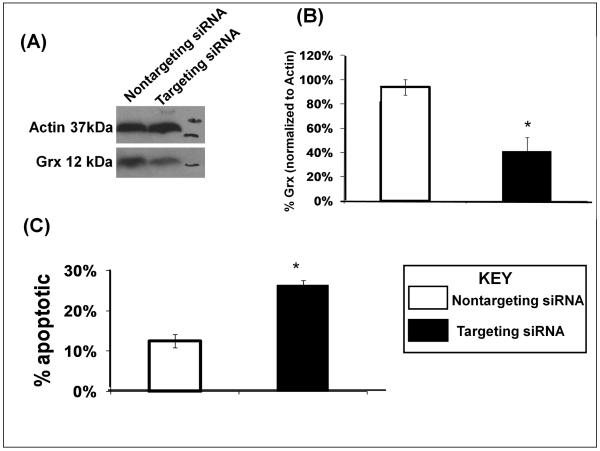
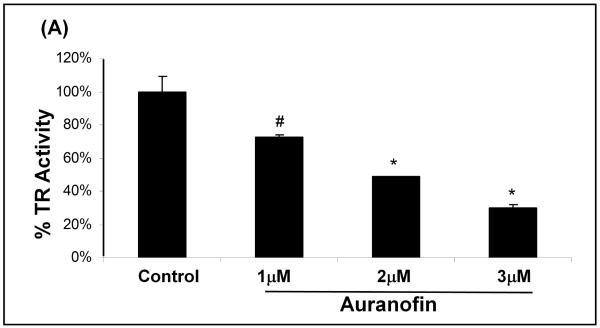
Parkinson's disease (PD), characterized by dopaminergic neuronal loss, is attributed to oxidative stress, diminished glutathione (GSH) levels, mitochondrial dysfunction, and protein aggregation. Treatment of PD involves chronic administration of Levodopa (l-DOPA) which is a pro-oxidant and may disrupt sulfhydryl homeostasis. The goal of these studies is to elucidate the effects of l-DOPA on thiol homeostasis in a model akin to PD, i.e., immortalized dopaminergic neurons (SHSY5Y cells) with diminished GSH content. These neurons exhibit hypersensitivity to l-DOPA-induced cell death, which is attributable to concomitant inhibition of the intracellular thiol disulfide oxidoreductase enzymes. Glutaredoxin (Grx) was deactivated in a dose-dependent fashion, but its content was unaffected. Glutathione disulfide (GSSG) reductase (GR) activity was not altered. Selective knockdown of Grx resulted in an increased level of apoptosis, documenting the role of the Grx system in neuronal survival. l-DOPA treatments also led to decreased activities of thioredoxin (Trx) and thioredoxin reductase (TR), concomitant with diminution of their cellular contents. Selective chemical inhibition of TR activity led to an increased level of apoptosis, documenting the Trx system's contribution to neuronal viability. To investigate the mechanism of inhibition at the molecular level, we treated the each isolated enzyme with oxidized l-DOPA. GR, Trx, and TR activities were little affected. However, Grx was inactivated in a time- and concentration-dependent fashion indicative of irreversible adduction of dopaquinone to its nucleophilic active-site Cys-22, consistent with the intracellular loss of Grx activity but not Grx protein content after l-DOPA treatment. Overall l-DOPA is shown to impair the collaborative contributions of the Grx and Trx systems to neuron survival.
Figures
 ). B. Pro-oxidant metabolism of L-DOPA. L-DOPA is oxidized to semiquinone and quinone forms, releasing superoxide. Also, L-DOPA undergoes a decarboxylation reaction by L-amino acid decarboxylase to form dopamine. Dopamine can undergo similar oxidations to L-DOPA forming both semiquinone and quinone species. Formation of these oxidized products results in the release of superoxide. Lastly, dopamine is degraded by monoamine oxidase forming 3,4-dihydroxyphenylacetic acid (DOPAC). Formation of this degradation product releases superoxide. Also, DOPAC can similarly form the reactive quinone species as shown in the bottom of 1B.
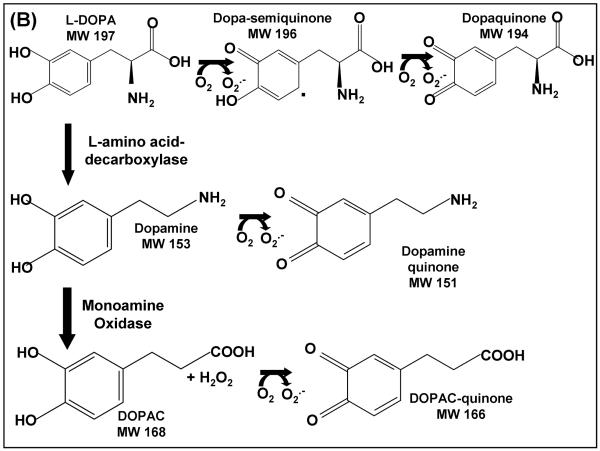 ). B. Pro-oxidant metabolism of L-DOPA. L-DOPA is oxidized to semiquinone and quinone forms, releasing superoxide. Also, L-DOPA undergoes a decarboxylation reaction by L-amino acid decarboxylase to form dopamine. Dopamine can undergo similar oxidations to L-DOPA forming both semiquinone and quinone species. Formation of these oxidized products results in the release of superoxide. Lastly, dopamine is degraded by monoamine oxidase forming 3,4-dihydroxyphenylacetic acid (DOPAC). Formation of this degradation product releases superoxide. Also, DOPAC can similarly form the reactive quinone species as shown in the bottom of 1B.
Similar articles
-
Levodopa activates apoptosis signaling kinase 1 (ASK1) and promotes apoptosis in a neuronal model: implications for the treatment of Parkinson's disease.Chem Res Toxicol. 2011 Oct 17;24(10):1644-52. doi: 10.1021/tx200082h. Epub 2011 Aug 22. Chem Res Toxicol. 2011. PMID: 21815648 Free PMC article.
-
The thioredoxin antioxidant system.Free Radic Biol Med. 2014 Jan;66:75-87. doi: 10.1016/j.freeradbiomed.2013.07.036. Epub 2013 Jul 27. Free Radic Biol Med. 2014. PMID: 23899494 Review.
-
Methylglyoxal causes dysfunction of thioredoxin and thioredoxin reductase in endothelial cells.J Pharmacol Sci. 2009 Dec;111(4):426-32. doi: 10.1254/jphs.09131fp. Epub 2009 Dec 5. J Pharmacol Sci. 2009. PMID: 19966511
-
Neuroprotective effect of L-dopa on dopaminergic neurons is comparable to pramipexol in MPTP-treated animal model of Parkinson's disease: a direct comparison study.J Neurochem. 2009 Nov;111(4):1042-50. doi: 10.1111/j.1471-4159.2009.06381.x. Epub 2009 Sep 16. J Neurochem. 2009. PMID: 19765187
-
Levodopa: effect on cell death and the natural history of Parkinson's disease.Mov Disord. 2015 Jan;30(1):37-44. doi: 10.1002/mds.26119. Epub 2014 Dec 11. Mov Disord. 2015. PMID: 25502620 Review.
Cited by
-
The vicious circle between homocysteine, methyl group-donating vitamins and chronic levodopa intake in Parkinson's disease.J Neural Transm (Vienna). 2024 Jun;131(6):631-638. doi: 10.1007/s00702-023-02666-x. Epub 2023 Jun 17. J Neural Transm (Vienna). 2024. PMID: 37329350 Review.
-
Upregulation of Glutaredoxin-1 Activates Microglia and Promotes Neurodegeneration: Implications for Parkinson's Disease.Antioxid Redox Signal. 2016 Dec 20;25(18):967-982. doi: 10.1089/ars.2015.6598. Epub 2016 Jun 27. Antioxid Redox Signal. 2016. PMID: 27224303 Free PMC article.
-
Emerging preclinical pharmacological targets for Parkinson's disease.Oncotarget. 2016 May 17;7(20):29835-63. doi: 10.18632/oncotarget.8104. Oncotarget. 2016. PMID: 26988916 Free PMC article. Review.
-
Dysregulation of glutathione homeostasis in neurodegenerative diseases.Nutrients. 2012 Oct 9;4(10):1399-440. doi: 10.3390/nu4101399. Nutrients. 2012. PMID: 23201762 Free PMC article. Review.
-
A functionalized hydroxydopamine quinone links thiol modification to neuronal cell death.Redox Biol. 2020 Jan;28:101377. doi: 10.1016/j.redox.2019.101377. Epub 2019 Nov 9. Redox Biol. 2020. PMID: 31760358 Free PMC article.
References
-
- Riedlerer PF. Views on neurodegeneration as a basis for neuroprotective strategies. Med. Sci. Monit. 2004;10:RA287–RA290. - PubMed
-
- Maguire-Zeiss KA, Short DW, Federoff HJ. Synuclein, dopamine and oxidative stress: co-conspirators in Parkinson’s disease? Brain Res. Mol. Brain Res. 2005;134:18–23. - PubMed
-
- Olanow CW, Tatton WG. Etiology and pathogenesis of Parkinson’s disease. Annu. Rev. Neurosci. 1999;22:123–144. - PubMed
-
- Asanuma M, Miyazaki I, az-Corrales FJ, Ogawa N. Quinone formation as dopaminergic neuron-specific oxidative stress in the pathogenesis of sporadic Parkinson’s disease and neurotoxin-induced parkinsonism. Acta Med. Okayama. 2004;58:221–233. - PubMed
Publication types
MeSH terms
Substances
Grants and funding
LinkOut - more resources
Full Text Sources
Medical
