. 2010 May 7;9(5):2182-90.
doi: 10.1021/pr900936z.

Molecular analysis of tumor margins by MALDI mass spectrometry in renal carcinoma

Affiliations

Molecular analysis of tumor margins by MALDI mass spectrometry in renal carcinoma

Stacey R Oppenheimer et al. J Proteome Res. .

Abstract

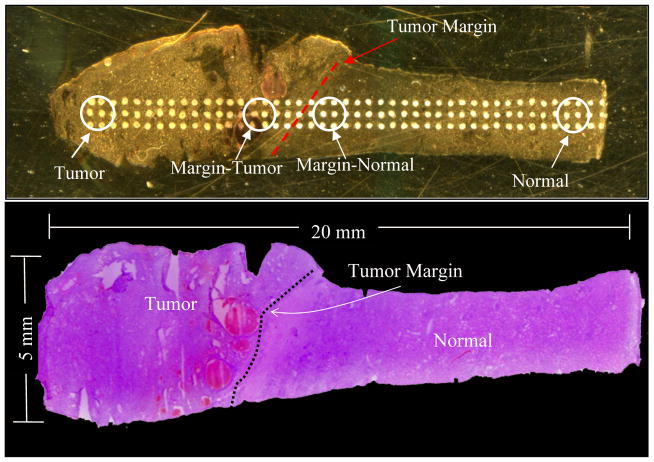
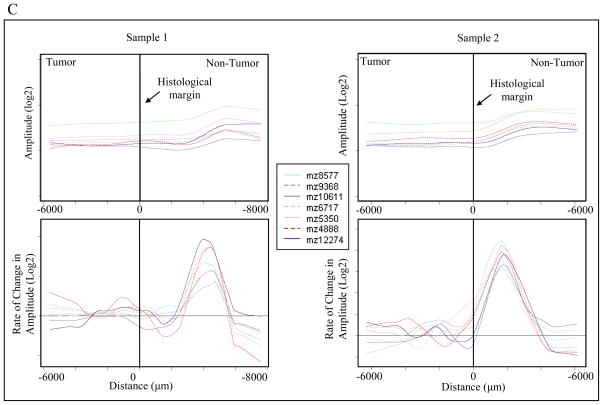
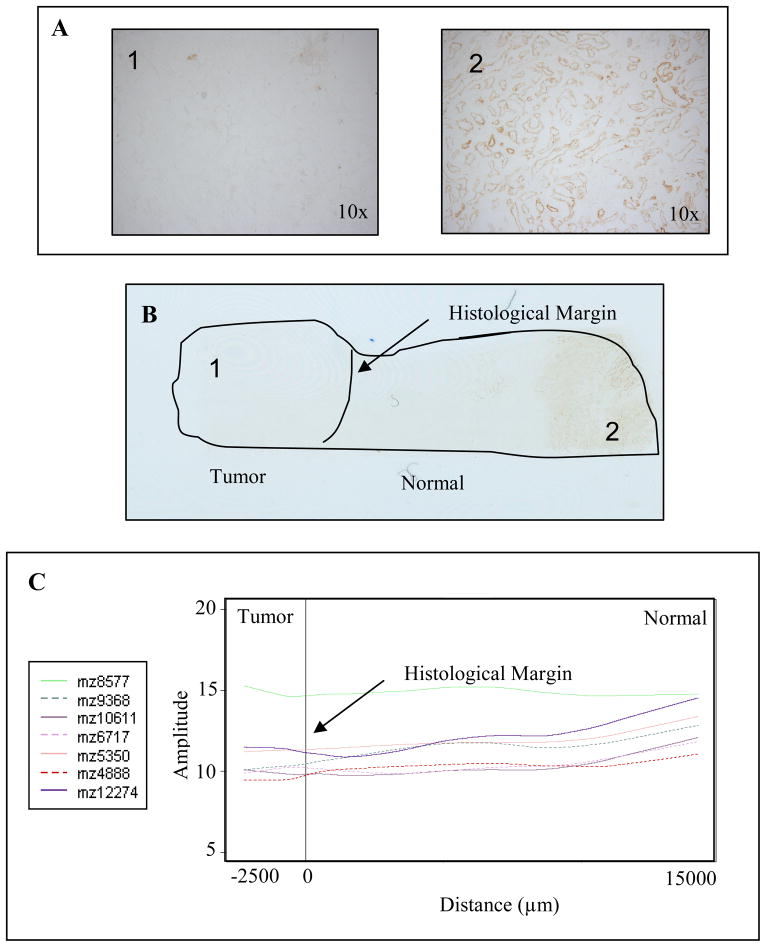
The rate of tumor recurrence post resection suggests that there are underlying molecular changes in nearby histologically normal tissue that go undetected by conventional diagnostic methods that utilize contrast agents and immunohistochemistry. MALDI MS is a molecular technology that has the specificity and sensitivity to monitor and identify molecular species indicative of these changes. The current study utilizes this technology to assess molecular distributions within a tumor and adjacent normal tissue in clear cell renal cell carcinoma biopsies. Results indicate that the histologically normal tissue adjacent to the tumor expresses many of the molecular characteristics of the tumor. Proteins of the mitochondrial electron transport system are examples of such distributions. This work demonstrates the utility of MALDI MS for the analysis of tumor tissue in the elucidation of aberrant molecular changes in the tumor microenvironment.


Figures

Figure 1
Figure 1
Regions of interest for statistical analysis of tumor margin profiles. (Top) Optical image of tumor and attached adjacent normal section on a MALDI plate with regions of interest marked; (Bottom) Optical image of a corresponding H&E stained section marked by a pathologist.
Figure 2
Figure 2
SAM statistics. (A) SAM statistics plot of results of tumor versus normal tissue (n = 75). Red circles indicate significant features that are over-expressed in tumor. The green circles indicate features significantly under-expressed in the tumor. (B) SAM statistics plot of results of margin normal versus normal tissue (n = 34). Green circles indicate features significantly under-expressed in margin normal tissue. Red circles indicate features significantly over-expressed in the margin normal tissue. Dotted lines represent the significance threshold (Δ) corresponding to FDR <0.01. Features have been arranged by their degree of difference in expression. Points to the right (top) or left (bottom) of the first point outside of the dotted line are called significant.
Figure 3
Figure 3
Expected and observed molecular patterns. This figure illustrates the observed patterns of the molecular features traversing the histological tumor margin. Lines A and C represent features that begin changing at the histological margin; while lines B and D represent features that change after the histological margin.
Figure 4
Figure 4
Demonstration of margin plot analysis. (A) LOWESS fit line of scatter plot data. (B) Top: LOWESS line of 40 selected significant features; Bottom: First Derivative of all LOWESS lines (x-axis error approximately +/−400 μm). (C) LOWESS and corresponding 1st derivative plots of 7 selected features for two representative samples. The notation “mz” represents m/z, or mass-to-charge ratio.
Figure 4
Figure 4
Demonstration of margin plot analysis. (A) LOWESS fit line of scatter plot data. (B) Top: LOWESS line of 40 selected significant features; Bottom: First Derivative of all LOWESS lines (x-axis error approximately +/−400 μm). (C) LOWESS and corresponding 1st derivative plots of 7 selected features for two representative samples. The notation “mz” represents m/z, or mass-to-charge ratio.
Figure 5
Figure 5
Cytochrome oxidase activity assay confirms localization of features. (A) Microscope images of tumor (1) and normal (2) regions of the tissue. (B) Scanned image of stained section shows localization. (C) LOWESS trend of features involved in mitochondrial electron transport.

References

    1. Looser KG, Shah JP, Strong EW. The significance of “positive” margins in surgically resected epidermoid carcinomas. Head Neck Surg. 1978;1(2):107–11. - PubMed
    1. Nathan CAO, Amirghahri N, Rice C, Abreo F, Shi R, Stucker S. Molecular Analysis of Surgical Margins in Head and Neck Squamous Cell Carcinoma Patients. The Laryngoscope. 2002;112:2129–2140. - PubMed
    1. Masasyesva BG, Tong BC, Brock MV, Pilkington T, Goldenberg D, Sidransky D, Harden S, Westra WH, Califano J. Molecular margin analysis predicts local recurrence after sublobar resection of lung cancer. Int J Cancer. 2005;113:1022–1025. - PubMed
    1. Balch GC, Mithani SK, Simpson JF, Kelley MC. Accuracy of intraoperative gross examination of surgical margin status in women undergoing partial mastectomy for breast malignancy. Am Surg. 2005;71(1):22–7. discussion 27–8. - PubMed
    1. Choong PF. Surgical margins for soft tissue sarcoma: size does matter. ANZ J Surg. 2006;76(3):97. - PubMed

Publication types

MeSH terms