. 2010 Feb;124(1):26-43.
doi: 10.1037/a0018464.

The role of the nucleus accumbens core in impulsive choice, timing, and reward processing

Affiliations

The role of the nucleus accumbens core in impulsive choice, timing, and reward processing

Tiffany Galtress et al. Behav Neurosci. 2010 Feb.

Abstract

The present series of experiments aimed to pinpoint the source of nucleus accumbens core (AcbC) effects on delay discounting. Rats were trained with an impulsive choice procedure between an adjusting smaller sooner reward and a fixed larger later reward. The AcbC-lesioned rats produced appropriate choice behavior when the reward magnitude was equal. An increase in reward magnitude resulted in a failure to increase preference for the larger later reward in the AcbC-lesioned rats, whereas a decrease in the larger later reward duration resulted in normal alterations in choice behavior in AcbC-lesioned rats. Subsequent experiments with a peak timing (Experiments 2 and 3) and a behavioral contrast (Experiment 4) indicated that the AcbC-lesioned rats suffered from decreased incentive motivation during changes in reward magnitude (Experiments 2 and 4) and when expected rewards were omitted (Experiments 2 and 3), but displayed intact anticipatory timing of reward delays (Experiments 2 and 3). The results indicate that the nucleus accumbens core is critical for determining the incentive value of rewards, but does not participate in the timing of reward delays.


Figures

Figure 1
Figure 1
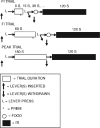
A diagram depicting the PIFI training trials and peak test trials during the pre- and postsurgery baseline phases. The key defines the different symbols used in the diagram. PI = progressive interval; FI = fixed interval; S = seconds; ITI = intertrial interval.
Figure 2
Figure 2
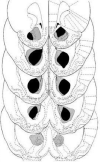
Left column: Photomicrograph of a representative sham control (top) and nucleus accumbens core (AcbC)-lesioned (bottom) section from the nucleus accumbens (Acb) region of the left hemisphere. Note the gliosis evident in the left portion of the section; the enlarged ventricle near the top; and the intact area to the right of the AcbC lesion when compared to the corresponding areas of the sham control brain. Right column: The largest (light gray) and smallest (black) areas of damage to the AcbC region of rats included in the analysis for Experiment 1. From The Rat Brain in Stereotaxic Coordinates, 3rd ed., by G. Paxinos & C. Watson, 1996, San Diego, CA: Academic. Copyright 1996 by Elsevier Science. Adapted with permission.
Figure 3
Figure 3
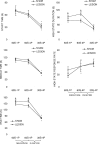
Change-over time as a function of phase of training for the sham control and nucleus accumbens core (AcbC)-lesioned groups of rats in Experiment 1. Error bars are ± 1 SEM. Asterisks mark significant changes during fixed-interval (FI) reward magnitude manipulation (60S–1P vs. 60S–4P) and FI duration manipulation (60S–4P vs. 30S–4P) phases of the experiment. Ampersands mark significant group differences (AcbC lesion vs. sham) within a phase of the experiment. S = seconds; 60S–1P = 60 s, one pellet; 60S–4P = 60 s, four pellets; 30S–4P = 30 s, four pellets.
Figure 4
Figure 4
Delay discounting rates (k) for the sham control and nucleus accumbens core (AcbC)-lesioned groups of rats as a function of phase of training in Experiment 1. Error bars are ± 1 SEM. Asterisks mark significant changes during fixed-interval (FI) reward magnitude manipulation (60S–1P vs. 60S–4P) and FI duration manipulation (60S–4P vs. 30S–4P) phases of the experiment. Ampersands mark significant group differences (AcbC lesion vs. sham) within a phase of the experiment. S = seconds; 60S–1P = 60 s, one pellet; 60S–4P = 60 s, four pellets; 30S–4P = 30 s, four pellets.
Figure 5
Figure 5
Response rate as a function of time since peak trial onset during the baseline (60S–1P), fixed-interval (FI) reward magnitude manipulation (60S–4P), and FI duration manipulation (30S–4P) in Experiment 1 in the sham control (top) and nucleus accumbens core (AcbC)-lesioned (bottom) groups of rats. S = seconds; 60S–1P = 60 s, one pellet; 60S–4P = 60 s, four pellets; 30S–4P = 30 s, four pellets.
Figure 6
Figure 6
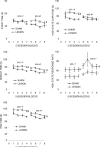
Results of the single-trial analyses conducted in Experiment 1: start time, middle time, end time, high state duration, and high state response rate as a function of phase of training in the sham control and nucleus accumbens core (AcbC)-lesioned groups of rats. Error bars are ± 1 SEM. Asterisks mark significant changes during fixed-interval (FI) reward magnitude manipulation (60S–1P vs. 60S–4P) and FI duration manipulation (60S–4P vs. 30S–4P) phases of the experiment. Ampersands mark significant group differences (AcbC lesion vs. sham) within a phase of the experiment. S = seconds; 60S–1P = 60 s, one pellet; 60S–4P = 60 s, four pellets; 30S–4P = 30 s, four pellets.
Figure 7
Figure 7
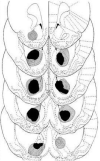
The largest (light gray) and smallest (black) areas of damage for the rats included in the analysis for Experiment 2. From The Rat Brain in Stereotaxic Coordinates, 3rd ed., by G. Paxinos & C. Watson, 1996, San Diego, CA: Academic. Copyright 1996 by Elsevier Science. Adapted with permission.
Figure 8
Figure 8
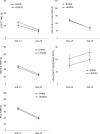
Top: Response functions from the fixed-interval (FI) reward magnitude manipulation (60S–1P vs. 60S–4P) in Experiment 2 in the sham control (S) and nucleus accumbens core (AcbC)-lesioned (L) groups. Bottom: Response functions from the FI duration manipulation (60S–4P vs. 30S–4P) in Experiment 2 in the sham control (S) and AcbC-lesioned (L) groups. 60S–1P = 60 s, one pellet; 60S–4P = 60 s, four pellets; 30S–4P = 30 s, four pellets.
Figure 9
Figure 9
Results of the single-trial analyses conducted in Experiment 2: start time, middle time, end time, high state duration, and high state response rate as a function five-session blocks of training in the sham control and nucleus accumbens core (AcbC)-lesioned groups of rats during the baseline (60S–1P) and reward magnitude manipulation (60S–4P) phases. Error bars are ± 1 SEM. Asterisks mark significant changes during fixed-interval (FI) reward magnitude manipulation (60S–1P vs. 60S–4P) phases of the experiment. Ampersands mark significant group differences (AcbC lesion vs. sham) within a phase of the experiment. S = seconds; 60S–1P = 60 s, one pellet; 60S–4P = 60 s, four pellets; 30S–4P = 30 s, four pellets.
Figure 10
Figure 10
Results of the single-trial analyses conducted in Experiment 2: start time, middle time, end time, high state duration, and high state response rate in the sham control and nucleus accumbens core (AcbC)-lesioned groups of rats during the fixed-interval (FI) duration manipulation. Error bars are ± 1 SEM. Asterisks mark significant changes during the FI duration manipulation (60S–4P vs. 30S–4P) phases of the experiment. S = seconds; 60S–1P = 60 s, one pellet; 60S–4P = 60 s, four pellets; 30S–4P = 30 s, four pellets.
Figure 11
Figure 11
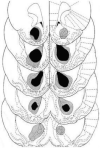
The largest (light gray) and smallest (black) areas of damage for the rats included in the analysis for Experiment 3. From The Rat Brain in Stereotaxic Coordinates, 3rd ed., by G. Paxinos & C. Watson, 1996, San Diego, CA: Academic. Copyright 1996 by Elsevier Science. Adapted with permission.
Figure 12
Figure 12
Response rate functions during the pre- and postsurgery phases of Experiment 3 in the sham control (S) and nucleus accumbens core (AcbC)-lesioned (L) groups. 60S–1P = 60 s, one pellet; 60S–4P = 60 s, four pellets; 30S–4P = 30 s, four pellets; pre = presurgery; post = postsurgery.
Figure 13
Figure 13
Results of the single-trial analyses conducted in Experiment 3: start time, middle time, end time, high state duration, and high state response rate in the sham control and nucleus accumbens core (AcbC)-lesioned groups of rats during the presurgery and postsurgery phases. Error bars are ± 1 SEM. Asterisks mark significant changes during pre- versus postsurgery phases of the experiment. Ampersands mark significant group differences (AcbC lesion vs. sham) within a phase of the experiment. S = seconds; 60S–1P = 60 s, one pellet; 60S–4P = 60 s, four pellets; 30S–4P = 30 s, four pellets; pre = presurgery; post = postsurgery.
Figure 14
Figure 14
The largest (light gray) and smallest (black) areas of damage for the rats included in the analysis for Experiment 4. From The Rat Brain in Stereotaxic Coordinates, 3rd ed., by G. Paxinos & C. Watson, 1996, San Diego, CA: Academic. Copyright 1996 by Elsevier Science. Adapted with permission.
Figure 15
Figure 15
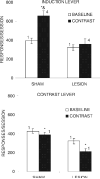
Top: Responses per session on the induction lever during the baseline and contrast phases of Experiment 4 in the sham control and nucleus accumbens core (AcbC)-lesioned groups of rats. Bottom: Responses per session on the contrast lever during the baseline and contrast phases of Experiment 4 in the sham control and AcbC-lesioned groups of rats. Error bars are ± 1 SEM. Asterisks mark significant changes during the contrast (vs. baseline) phase of the experiment. Ampersands mark significant group differences (AcbC lesion vs. sham) within a phase of the experiment. The reward magnitude for each lever is indicated above each bar in the figure.

Similar articles

Cited by

References

    1. Acheson A, Farrar AM, Patak M, Hausknecht KA, Kieres AK, Choi S, Richards JB. Nucleus accumbens lesions decrease sensitivity to rapid changes in the delay to reinforcement. Behavioural Brain Research. 2006;173:217–228. - PMC - PubMed
    1. Balleine B, Killcross S. Effects of ibotenic acid lesions of the nucleus accumbens on instrumental action. Behavioural Brain Research. 1994;65:181–193. - PubMed
    1. Barkley RA, Edwards G, Laneri M, Fletcher K, Metevia L. The efficacy of problem-solving communication training alone, behavior management training alone, and their combination for parent-adolescent conflict in teenagers with ADHD and ODD. Journal of Consulting and Clinical Psychology. 2001;69:926–941. - PubMed
    1. Belin D, Jonkman S, Dickinson A, Robbins TW, Everitt BJ. Parallel and interactive learning processes within the basal ganglia: Relevance for the understanding of addiction. Behavioural Brain Research. 2009;199:89–102. - PubMed
    1. Bezzina G, Cheung THC, Asgari K, Hampson CL, Body S, Bradshaw CM, Anderson IM. Effects of quinolinic acid-induced lesions of the nucleus accumbens core on inter-temporal choice: A quantitative analysis. Psychopharmacology (Berlin) 2007;195:71–84. - PMC - PubMed

Publication types