

Brainstem and hypothalamic regulation of sleep pressure and rebound in newborn rats
- PMID: 20141281
- PMCID: PMC2823806
- DOI: 10.1037/a0018100
Brainstem and hypothalamic regulation of sleep pressure and rebound in newborn rats
Abstract
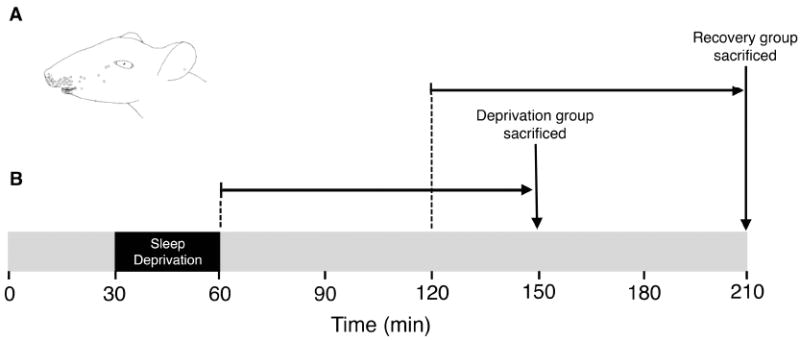
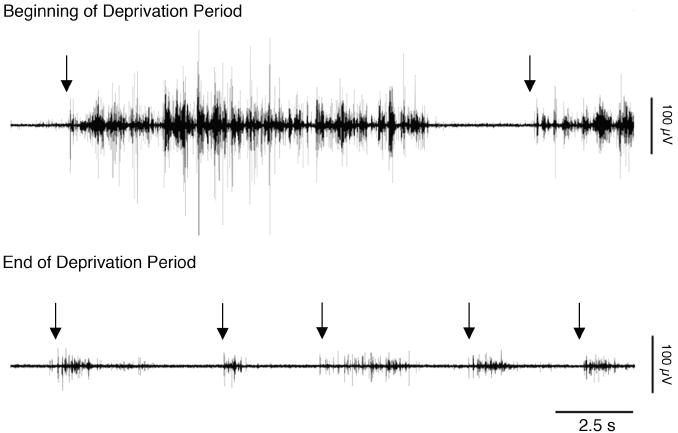
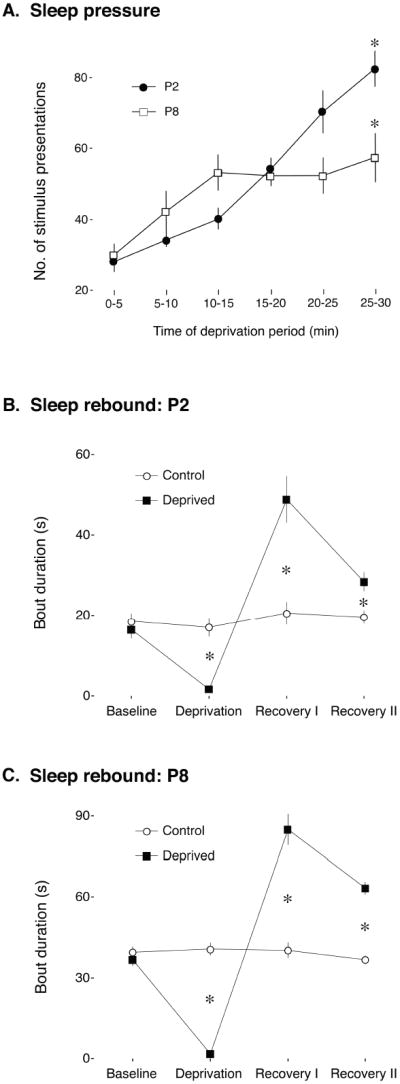
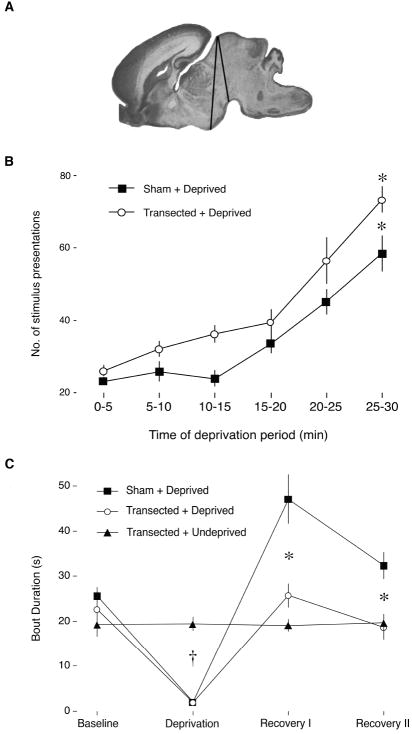
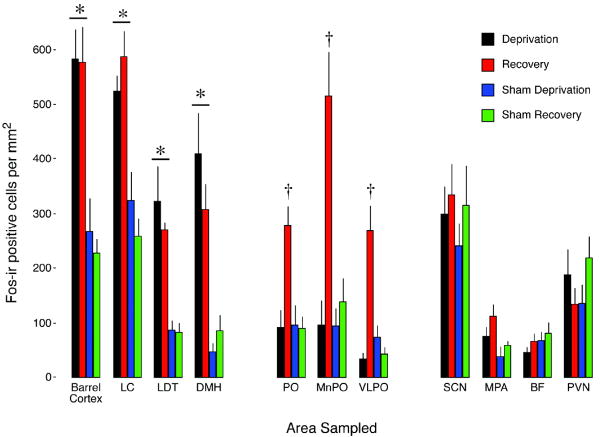
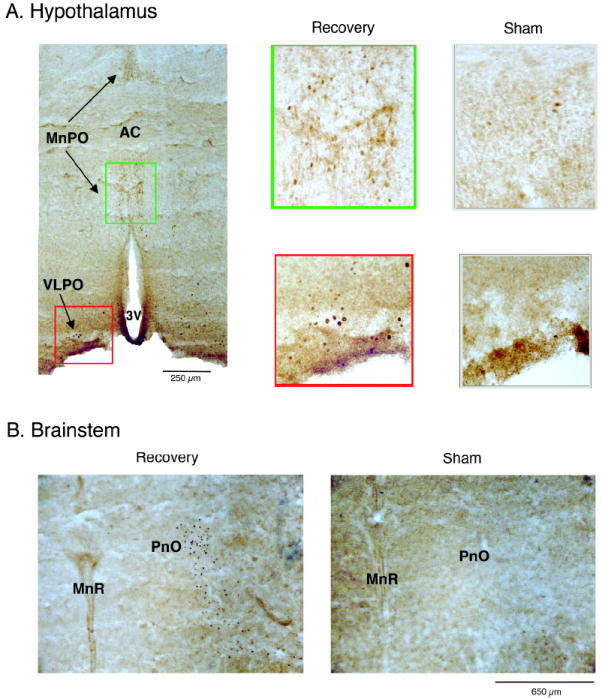
Sleep pressure and rebound comprise the two compensatory or "homeostatic" responses to sleep deprivation. Although sleep pressure is expressed by infant rats as early as postnatal day (P)5, sleep rebound does not appear to emerge until after P11. We reexamined the developmental expression of these sleep-regulatory processes in P2 and P8 rats by depriving them of sleep for 30 min using a cold, arousing stimulus delivered to a cold-sensitive region of the snout. This method effectively increased sleep pressure over the 30-min period (i.e., increases in the number of arousing stimuli presented over time). Moreover, sleep rebound (i.e., increased sleep during the recovery period) is demonstrated for the first time at these ages. Next, we showed that precollicular transections in P2 rats prevent sleep rebound without affecting sleep pressure, suggesting that the brainstem is sufficient to support sleep pressure, but sleep rebound depends on neural mechanisms that lie rostral to the transection. Finally, again in P2 rats, we used c-fos immunohistochemistry to examine neural activation throughout the neuraxis during sleep deprivation and recovery. Sleep deprivation and rebound were accompanied by significant increases in neural activation in both brainstem and hypothalamic nuclei, including the ventrolateral preoptic area and median preoptic nucleus. This early developmental expression of sleep pressure and rebound and the apparent involvement of brainstem and hypothalamic structures in their expression further solidify the notion that sleep-wake processes in newborns-defined at these ages without reference to state-dependent EEG activity-provide the foundation on which the more familiar processes of adults are built.
(c) 2009 APA, all rights reserved.
Figures
Similar articles
-
c-Fos expression in preoptic nuclei as a marker of sleep rebound in the rat.Eur J Neurosci. 2009 Aug;30(4):651-61. doi: 10.1111/j.1460-9568.2009.06848.x. Epub 2009 Aug 3. Eur J Neurosci. 2009. PMID: 19686475
-
Counterpointing the functional role of the forebrain and of the brainstem in the control of the sleep-waking system.J Sleep Res. 2004 Sep;13(3):179-208. doi: 10.1111/j.1365-2869.2004.00412.x. J Sleep Res. 2004. PMID: 15339255 Review.
-
Sleep homeostasis in infant rats.Behav Neurosci. 2004 Dec;118(6):1253-61. doi: 10.1037/0735-7044.118.6.1253. Behav Neurosci. 2004. PMID: 15598134 Free PMC article.
-
The role of adenosine in the maturation of sleep homeostasis in rats.J Neurophysiol. 2017 Jan 1;117(1):327-335. doi: 10.1152/jn.00675.2016. Epub 2016 Oct 26. J Neurophysiol. 2017. PMID: 27784808 Free PMC article.
-
[Neurochemical mechanisms of sleep regulation].Glas Srp Akad Nauka Med. 2009;(50):97-109. Glas Srp Akad Nauka Med. 2009. PMID: 20666118 Review. Serbian.
Cited by
-
The development of sleep-wake rhythms and the search for elemental circuits in the infant brain.Behav Neurosci. 2014 Jun;128(3):250-63. doi: 10.1037/a0035891. Epub 2014 Apr 7. Behav Neurosci. 2014. PMID: 24708298 Free PMC article. Review.
-
Development of Circadian Sleep Regulation in the Rat: A Longitudinal Study Under Constant Conditions.Sleep. 2017 Mar 1;40(3):zsw077. doi: 10.1093/sleep/zsw077. Sleep. 2017. PMID: 28364421 Free PMC article.
-
Cortical development, electroencephalogram rhythms, and the sleep/wake cycle.Biol Psychiatry. 2015 Jun 15;77(12):1071-8. doi: 10.1016/j.biopsych.2014.12.017. Epub 2014 Dec 24. Biol Psychiatry. 2015. PMID: 25680672 Free PMC article. Review.
-
Effects of sleep and waking on the synaptic ultrastructure.Philos Trans R Soc Lond B Biol Sci. 2020 May 25;375(1799):20190235. doi: 10.1098/rstb.2019.0235. Epub 2020 Apr 6. Philos Trans R Soc Lond B Biol Sci. 2020. PMID: 32248785 Free PMC article.
-
Cortical parvalbumin neurons are responsible for homeostatic sleep rebound through CaMKII activation.Nat Commun. 2024 Jul 18;15(1):6054. doi: 10.1038/s41467-024-50168-5. Nat Commun. 2024. PMID: 39025867 Free PMC article.
References
-
- Alfoldi P, Tobler I, Borbely AA. Sleep regulation in rats during early development. American Journal of Physiology. 1990;258:R634–644. - PubMed
-
- Berger RJ, Meier GW. The effects of selective deprivation of states of sleep in the developing monkey. Psychophysiology. 1966;2:354–371.
-
- Blumberg MS. The developmental context of thermal homeostasis. In: Blass EM, editor. Handbook of Behavioral Neurobiology. Vol. 13. New York: Plenum Press; 2001. pp. 199–228.
-
- Blumberg MS. The form and function of infant sleep: From muscle to neocortex. In: Blumberg MS, Freeman JH, Robinson SR, editors. The Oxford handbook of developmental behavioral neuroscience. New York: Oxford; 2010. pp. 391–423.
Publication types
MeSH terms
Substances
Grants and funding
LinkOut - more resources
Full Text Sources
Miscellaneous
