Contrasting the edge- and surface-based theories of object recognition: behavioral evidence from macaques (Macaca mulatta)
- PMID: 20141325
- PMCID: PMC4199308
- DOI: 10.1037/a0015629
Contrasting the edge- and surface-based theories of object recognition: behavioral evidence from macaques (Macaca mulatta)
Abstract
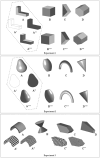
This study assessed the contribution of edge and surface cues on object representation in macaques (Macaca mulatta). In Experiments 1 and 2, 5 macaques were trained to discriminate 4 simple volumetric objects (geons) and were subsequently tested for their ability to recognize line drawings, silhouettes, and light changes of these geons. Performance was above chance in all test conditions and was similarly high for the line drawings and silhouettes of geons, suggesting the use of the outline shape to recognize the original objects. In addition, transfer for the geons seen under new lighting was greater than for the other stimuli, stressing the importance of the shading information. Experiment 3, using geons filled with new textures, showed that a radical change in the surface cues does not prevent object recognition. It is concluded that these findings support a surface-based theory of object recognition in macaques, although it does not exclude the contribution of edge cues, especially when surface details are not available.
Figures


Similar articles
-
What do Arabic numerals mean to macaques (Macaca mulatta)?J Exp Psychol Anim Behav Process. 2010 Jan;36(1):66-76. doi: 10.1037/a0016485. J Exp Psychol Anim Behav Process. 2010. PMID: 20141318 Free PMC article.
-
Large-Scale, High-Resolution Comparison of the Core Visual Object Recognition Behavior of Humans, Monkeys, and State-of-the-Art Deep Artificial Neural Networks.J Neurosci. 2018 Aug 15;38(33):7255-7269. doi: 10.1523/JNEUROSCI.0388-18.2018. Epub 2018 Jul 13. J Neurosci. 2018. PMID: 30006365 Free PMC article.
-
Solid shape discrimination from vision and haptics: natural objects (Capsicum annuum) and Gibson's "feelies".Exp Brain Res. 2012 Oct;222(3):321-32. doi: 10.1007/s00221-012-3220-7. Epub 2012 Aug 25. Exp Brain Res. 2012. PMID: 22918607
-
Accuracy of Rats in Discriminating Visual Objects Is Explained by the Complexity of Their Perceptual Strategy.Curr Biol. 2018 Apr 2;28(7):1005-1015.e5. doi: 10.1016/j.cub.2018.02.037. Epub 2018 Mar 15. Curr Biol. 2018. PMID: 29551414 Free PMC article.
-
Contributions of ideal observer theory to vision research.Vision Res. 2011 Apr 13;51(7):771-81. doi: 10.1016/j.visres.2010.09.027. Epub 2010 Nov 9. Vision Res. 2011. PMID: 20920517 Free PMC article. Review.
Cited by
-
First- and second-order configural sensitivity for greeble stimuli in baboons.Learn Behav. 2010 Nov;38(4):374-81. doi: 10.3758/LB.38.4.374. Learn Behav. 2010. PMID: 21048228
References
-
- Biederman I. Recognition-by-components: A theory of human image understanding. Psychological Review. 1987;94:115–147. - PubMed
-
- Biederman I, Ju G. Surface- versus edge-based determinants of visual recognition. Cognitive Psychology. 1988;20:38–64. - PubMed
-
- Davenport RK, Rogers CM, Russel IS. Cross-modal perception in apes: Altered visual cues and delay. Neuropsychologia. 1975;13:229–235. - PubMed
-
- Dean P. Effects of inferotemporal lesions on the behavior of monkeys. Psychological Bulletin. 1976;83:41–71. - PubMed

