Comparative Study
. 2010 Apr;76(1):12-24.
doi: 10.1111/j.1365-2958.2009.07026.x. Epub 2010 Feb 4.

New insights into the blood-stage transcriptome of Plasmodium falciparum using RNA-Seq

Affiliations
Free PMC article
Comparative Study

New insights into the blood-stage transcriptome of Plasmodium falciparum using RNA-Seq

Thomas D Otto et al. Mol Microbiol. 2010 Apr.
Free PMC article

Abstract

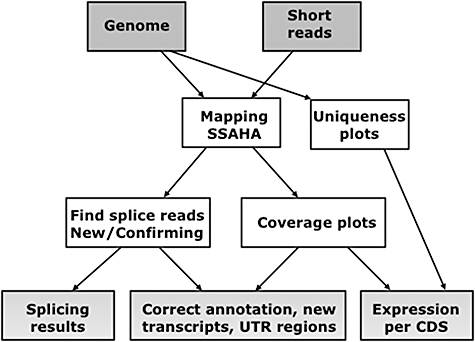
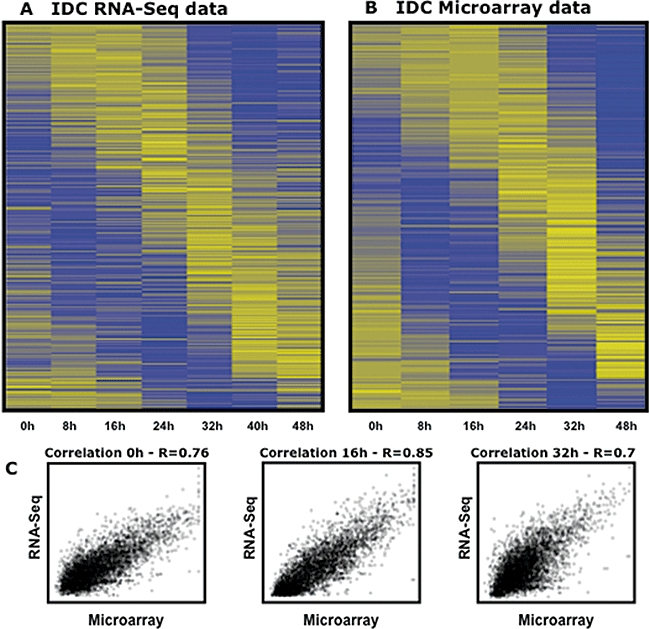
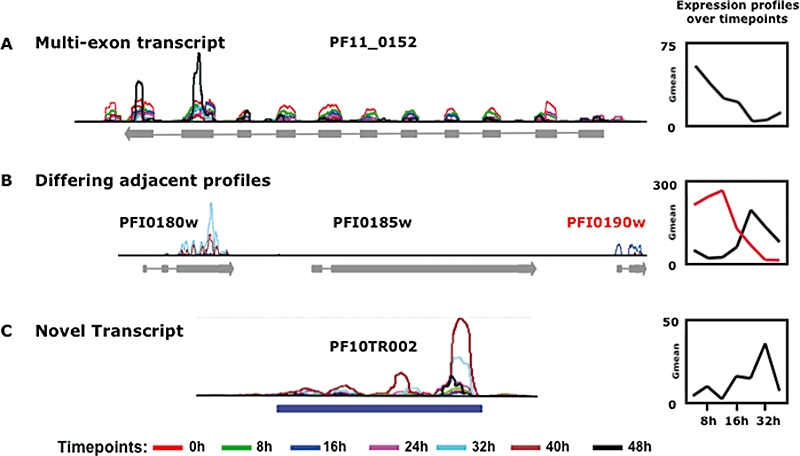
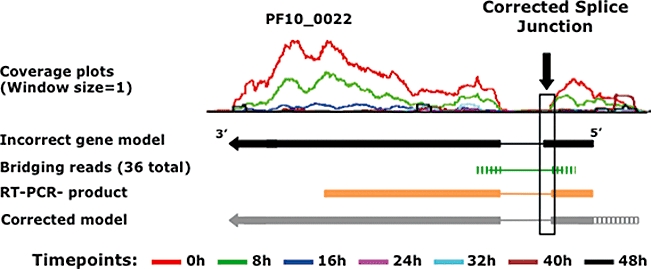
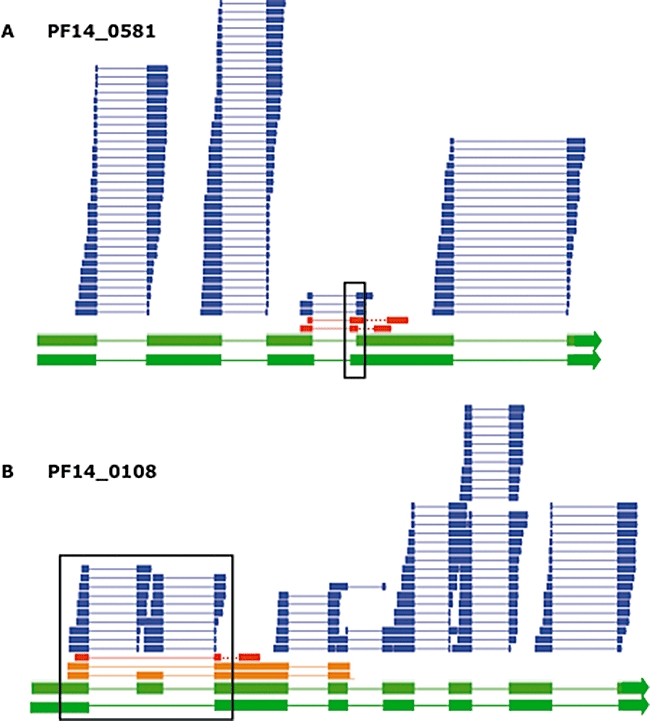
Recent advances in high-throughput sequencing present a new opportunity to deeply probe an organism's transcriptome. In this study, we used Illumina-based massively parallel sequencing to gain new insight into the transcriptome (RNA-Seq) of the human malaria parasite, Plasmodium falciparum. Using data collected at seven time points during the intraerythrocytic developmental cycle, we (i) detect novel gene transcripts; (ii) correct hundreds of gene models; (iii) propose alternative splicing events; and (iv) predict 5' and 3' untranslated regions. Approximately 70% of the unique sequencing reads map to previously annotated protein-coding genes. The RNA-Seq results greatly improve existing annotation of the P. falciparum genome with over 10% of gene models modified. Our data confirm 75% of predicted splice sites and identify 202 new splice sites, including 84 previously uncharacterized alternative splicing events. We also discovered 107 novel transcripts and expression of 38 pseudogenes, with many demonstrating differential expression across the developmental time series. Our RNA-Seq results correlate well with DNA microarray analysis performed in parallel on the same samples, and provide improved resolution over the microarray-based method. These data reveal new features of the P. falciparum transcriptional landscape and significantly advance our understanding of the parasite's red blood cell-stage transcriptome.


Figures

Fig. 1
Fig. 1
Workflow of short read processing for gene expression analysis by RNA-Seq. The Illumina sequencing reads are mapped with SSAHA2 (Ning et al., 2001) against the Plasmodium falciparum 3D7 genome. After mapping, splice reads and coverage plots are obtained. The splice reads are used to confirm or find new splice sites as well as alternative splice sites. The coverage plots show the RNA expression levels over each base pair of the genome. To calculate the expression per CDS per time point, the coverage plots and the uniqueness plots are used. Uniqueness plots indicate the uniqueness of a particular region of the genome. Using the coverage, it is possible to identify incorrect annotation, novel transcripts and potential untranslated regions (UTRs) of protein coding transcripts (as described in the text).
Fig. 2
Fig. 2
Expression profiles of 3975 annotated genes at seven time points in the intra-erythrocytic developmental cycle (IDC) of P. falciparum 3D7 and comparison of RNA-Seq data with microarray data. A. Heat map of genes expressed in the IDC cycle (Bozdech et al., 2003) with the RNA-Seq data. B. Heat map of genes expressed in the IDC cycle, derived from microarray experiments using the identical biological samples. C. Pearson correlation between the RNA-Seq and the microarray data sets.
Fig. 3
Fig. 3
RNA-Seq coverage plots for selected genes and their corresponding expression profiles (expressed as gmean) at seven time points in the intra-erythrocytic developmental cycle (IDC) of P. falciparum 3D7. A. Expression profile of a multi-exon gene PF11_0152 (GTPase activator) [maximal expression 423 (gmean)]. B. Expression profiles of three adjacent genes: PFI0180w (max expression 2000), PFI0185w (no expression) and PFI0190w (max expression 780) on chromosome 9, showing opposite temporal regulation of expression for PFI0180w (alpha tubulin – black profile plot), PFI0190w (60S ribosomal protein L32 – red profile plot) and lack of expression for PFI0185w. C. Expression profile of a novel mlncRNA transcript (PF10TR002, see in Table S5) identified on Chr10 (max expression 580).
Fig. 4
Fig. 4
Use of RNA-Seq data in correction of gene models in P. falciparum 3D7. An example is shown where a previously incorrect predicted gene model was corrected using RNA-Seq evidence for the gene PF10_0022 [Plasmodium exported protein (PHISTc)]. The coverage plots indicate that the first exon is shorter by 27 bp at the 3′ end. The arrow and black boxed areas highlight the location of structural changes incorporated in the gene PF10_0022. The correctly spliced form is confirmed by 36 known bridging reads (green features). This new splice site was confirmed by RT-PCR (orange features). Coverage plots also identified the 5′ UTR in PF10_0022 (shown by grey striped feature). The incorrect gene model was taken from the published version of the P. falciparum 3D7 genome (Gardner et al., 2002).
Fig. 5
Fig. 5
Use of RNA-Seq data to detect alternative splicing and exon skipping events in the IDC transcriptome of P. falciparum 3D7. A. Alternative splice sites for exon 4 of PF14_0581 (putative apicoplast ribosomal protein isoforms) highlighted by aligned bridging reads (red) from early ring time points. The boxed area highlights the location of alternative splicing in the gene PF14_0581. The dotted red line links read pairs from the same template DNA. The blue bars show reads that map to the borders of exons, across an intron. Perfectly mapping reads are not shown. B. Example of exon skipping in PF14_0108 (a predicted protein of unknown function). A new splice form was indicated by a read mapping across two introns and exon, and its read pair (red). Both splice-forms were confirmed by RT-PCR (orange boxes). The boxed area highlights the location of exon skipping in the gene PF14_0108. Only the last eight exons of PF14_0108 are shown in the figure.

Similar articles

Cited by

References

    1. Arav-Boger R, Shapiro TA. Molecular mechanisms of resistance in antimalarial chemotherapy: the unmet challenge. Annu Rev Pharmacol Toxicol. 2005;45:565–585. - PubMed
    1. Aravind L, Iyer LM, Wellems TE, Miller LH. Plasmodium biology: genomic gleanings. Cell. 2003;115:771–785. - PubMed
    1. Bahl A, Brunk B, Crabtree J, Fraunholz MJ, Gajria B, Grant GR, et al. PlasmoDB: the Plasmodium genome resource. A database integrating experimental and computational data. Nucleic Acids Res. 2003;31:212–215. - PMC - PubMed
    1. Bentley DR, Balasubramanian S, Swerdlow HP, Smith GP, Milton J, Brown CG, et al. Accurate whole human genome sequencing using reversible terminator chemistry. Nature. 2008;456:53–59. - PMC - PubMed
    1. Bloom JS, Khan Z, Kruglyak L, Singh M, Caudy AA. Measuring differential gene expression by short read sequencing: quantitative comparison to 2-channel gene expression microarrays. BMC Genomics. 2009;10:221. - PMC - PubMed

Publication types