. 2009 Aug;13(8B):2365-75.
doi: 10.1111/j.1582-4934.2009.00680.x.

Characterization of the S-denitrosylating activity of bilirubin

Affiliations

Characterization of the S-denitrosylating activity of bilirubin

Eugenio Barone et al. J Cell Mol Med. 2009 Aug.

Abstract

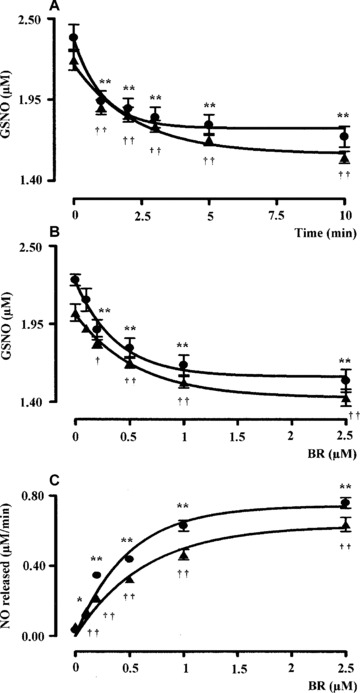
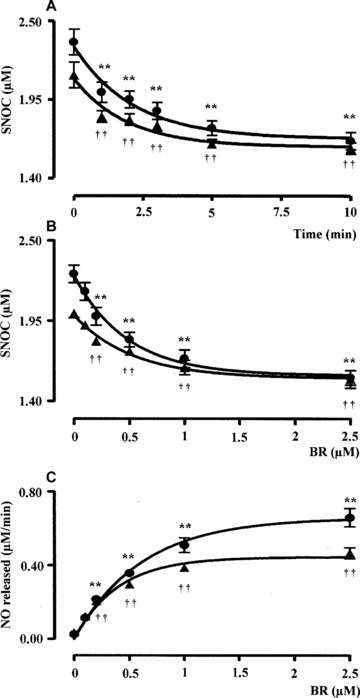
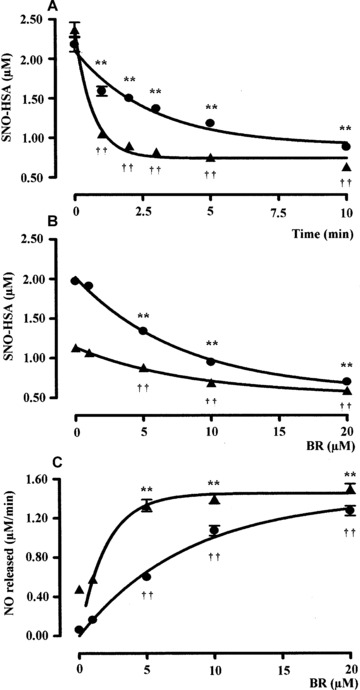
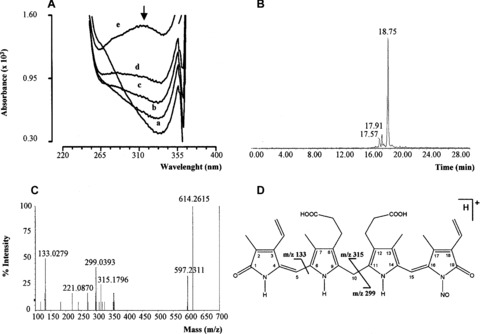
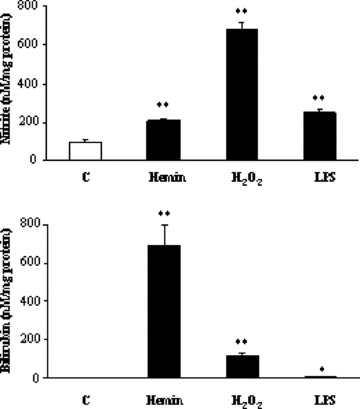
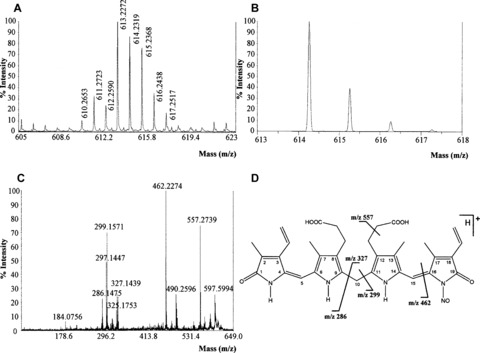
Bilirubin-IX-alpha (BR) is an endogenous molecule with a strong antioxidant feature due to its ability to scavenge free radicals. In this paper, we demonstrated that BR, at concentrations close to those found within the cell (0.1-2.5 microM), acted as a denitrosylating agent and increased the release of nitric oxide from S-nitrosoglutathione (GSNO) and S-nitrosocysteine (SNOC) (2.5 microM). The complexation of BR with saturating concentrations of human serum albumin (HSA, 2.5 microM) did not further increase nitric oxide release from GSNO and SNOC. At concentrations similar to those reached in plasma (5-20 microM), BR denitrosylated S-nitroso-HSA (2.5 microM), the main circulating S-nitrosothiol, and this effect was potentiated by the complexation of BR with saturating HSA (20 microM). Furthermore, the product(s) of the reaction between nitric oxide and BR were identified. Ultraviolet and mass spectrometry analysis revealed that nitric oxide binds to BR forming a N-nitroso derivative (BR-nitric oxide) with extinction coefficients of 1.393 mM(-1)cm(-1) and 2.254 mM(-1)cm(-1) in methanol and NaOH, respectively. The formation of BR-nitric oxide did not occur only in a reconstituted system, but was confirmed in rat fibroblasts exposed to pro-oxidant stimuli. These results provided novel insights on the antioxidant characteristic of BR through its interaction with nitric oxide, a gaseous neurotransmitter with a well-known dual effect, namely neuroprotective under physiological conditions or neurotoxic if produced in excess, and proposed BR-nitric oxide as a new biomarker of oxidative/nitrosative stress.


Figures

Figure 1
Figure 1
(A) Kinetic analysis, (B) dose–response curve and (C) initial rate of NO release following the interaction of bilirubin with S‐nitrosoglutathione (GSNO). (A) Bilirubin alone (BR, 0.5 μM, filled circle) or complexed with human serum albumin (HSA, 2.5 μM, filled triangle) was reacted with the l.m.w. S‐nitrosothiol GSNO (2.5 μM) in PBS/EDTA (0.1 mM), pH 7.4 at 37°C in the dark and the degradation of GSNO was monitored over time by spectrophotometric analysis as described in ‘Materials and methods’. (B) Bilirubin alone (0.1–2.5 μM, filled circle) or complexed with HSA as above (filled triangle) were reacted with GSNO 2.5 μM in PBS/EDTA (0.1 mM), pH 7.4 for 5 min. at 37°C in the dark and the degradation of GSNO was calculated as explained in ‘Materials and methods’. (C) The initial rate of nitric oxide release calculated from (B) was plotted against the respective BR/BR–HSA concentration as above. Data are expressed as mean ± S.E.M. of six replicates per group. * or P < 0.05 and ** or †† P < 0.01 versus time 0 in (A) and 0 μM BR in (BC) (anova corrected by Dunnet’s post hoc test). Furthermore, in (C) P < 0.05 between 0.5–2.5 μM BR–HSA versus BR alone (Student’s t‐test).
Figure 2
Figure 2
(A) Kinetic analysis, (B) dose–response curve and (C) initial rate of nitric oxide release following the interaction of bilirubin with the l.m.w. S‐nitrosocysteine (2.5 μM). Experimental conditions and symbols were the same as in Fig. 1. Data are expressed as mean ± S.E.M. of six replicates per group. * or P < 0.05 and ** or †† P < 0.01 versus time 0 in (A) and 0 μM BR in (BC) (anova corrected by Dunnet’s post hoc test). Furthermore, in (C) P < 0.05 between 0.5–2.5 μM BR–HSA versus BR alone (Student’s t‐test).
Figure 3
Figure 3
(A) Kinetic analysis, (B) dose–response curve and (C) initial rate of nitric oxide release following the interaction of bilirubin with S‐nitrosoalbumin. (A) Bilirubin alone (BR, 5 μM, filled circle) or complexed with human serum albumin (HSA, 20 μM, filled triangle) was reacted with the h.m.w. RSNO S‐nitrosoalbumin (SNO–HSA, 2.5 μM) in PBS/EDTA (0.1 mM), pH 7.4 at 37°C in the dark and the degradation of SNO–HSA was monitored over time by spectrophotometric analysis as described in ‘Materials and methods’. (B) Bilirubin alone (1–20 μM, filled circle) or complexed with HSA as above (filled triangle) were reacted with SNO–HSA 2.5 μM in PBS/EDTA (0.1 mM), pH 7.4 for 5 min. at 37°C in the dark and the degradation of SNO–HSA was calculated as explained in ‘Materials and methods’. (C) The initial rate of nitric oxide release calculated from (B) was plotted against the respective BR/BR–HSA concentration as above. Data are expressed as mean ± S.E.M. of six replicates per group. ** or †† P < 0.01 versus time 0 in (A) and 0 μM BR in (B‐C) (anova corrected by Dunnet’s post hoc test). Furthermore, in (A) P < 0.05 between 1–10 min. of incubation with BR–HSA and in (BC) P < 0.05 between 1–20 μM BR–HSA versus BR alone (Student’s t‐test).
Figure 4
Figure 4
Biochemical analysis of nitrosated bilirubin (BR–nitric oxide) (A) S‐nitrosocysteine (SNOC, 2.5 μM) was added to 2.5 μM bilirubin (BR) in PBS/EDTA (0.1 mM), pH 7.4 at 37°C in the dark and spectra recorded at time 0 (a) and after 1 (b), 2 (c), 5 (d) and 10 (e) minutes. The arrow indicates peak at 316 nm. Bilirubin (10 mM) was reacted with sodium nitrite (10 mM) in 0.5 M HCl at 37°C for 2 hrs in the dark. At the end of incubation, BR–nitric oxide was analysed by (B) HPLC/MS and (C) MS/MS as described in ‘Materials and methods’. (D) Structure and main fragments of BR–nitric oxide (for further information see text). Representative UV spectra (A), extracted ion chromatogram of BR–nitric oxide (B) and MS/MS spectrum of BR–nitric oxide (C) are shown.
Figure 5
Figure 5
Nitrite and bilirubin formation under pro‐oxidant conditions in Rat‐1 fibroblasts. Rat‐1 fibroblasts were exposed to hemin (H, 500 μM for 6 hrs plus 18 hrs in serum‐free medium), hydrogen peroxide (H2O2, 500 μM for 6 hrs plus 18 hrs in serum‐free medium) and bacterial lipopolysaccharide (2 μg/ml for 24 hrs in 1% FBS medium). At the end of incubation, medium was collected and assayed for nitrite and BR as described under ‘Materials and methods’. Data are expressed as mean ± S.E.M. of three replicates per group. *P < 0.05 and **P < 0.01 versus control (Ctrl).
Figure 6
Figure 6
Experimental mass spectrometry of N‐nitrosated bilirubin (BR–nitric oxide). Rat‐1 fibroblasts were treated as in Fig. 5. At the end of incubation, cells were extracted in methanol and subjected to MALDI‐TOF/TOF MS/MS as described under ‘Materials and methods’. Representative experimental MALDI‐MS (A), theoretical MALDI‐MS (B) and MALDI‐MS/MS (C) spectra of BR–nitric oxide are shown. (D) Structure and main fragments of BR–nitric oxide (for further information see text).

Similar articles

Cited by

References

    1. Kutty RK, Maines MD. Purification and characterization of biliverdin reductase from rat liver. J Biol Chem . 1981; 256: 3956–62. - PubMed
    1. Maines MD. Heme oxygenase: function, multiplicity, regulatory mechanisms, and clinical applications. FASEB J . 1988; 2: 2557–68. - PubMed
    1. Kapitulnik J. Bilirubin: an endogenous product of heme degradation with both cytotoxic and cytoprotective properties. Mol Pharmacol . 2004; 66: 773–9. - PubMed
    1. Ostrow JD, Pascolo L, Shapiro SM, et al . New concepts in bilirubin encephalopathy. Eur J Clin Invest . 2003; 33: 988–97. - PubMed
    1. Stocker R, Glazer AN, Ames BN. Antioxidant activity of albumin‐bound bilirubin. Proc Natl Acad Sci USA . 1987; 84: 5918–22. - PMC - PubMed

Publication types