. 2010 Feb 8:11:95.
doi: 10.1186/1471-2164-11-95.

Genome-wide analysis of rice ClpB/HSP100, ClpC and ClpD genes

Affiliations

Genome-wide analysis of rice ClpB/HSP100, ClpC and ClpD genes

Amanjot Singh et al. BMC Genomics. .

Abstract

Background: ClpB-cyt/HSP100 protein acts as chaperone, mediating disaggregation of denatured proteins. Previous studies have shown that ClpB-cyt/HSP100 gene belongs to the group class I Clp ATPase proteins and ClpB-cyt/HSP100 transcript is regulated by heat stress and developmental cues.

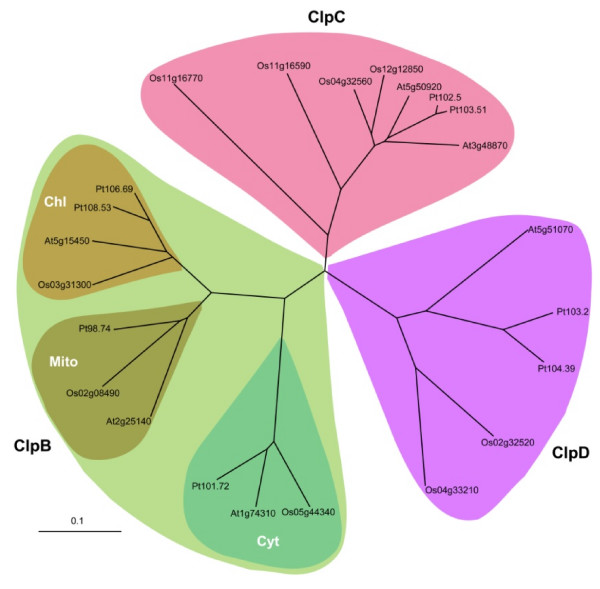
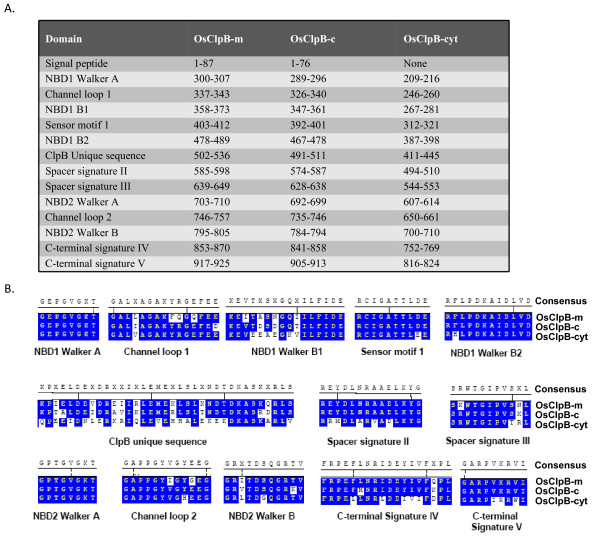
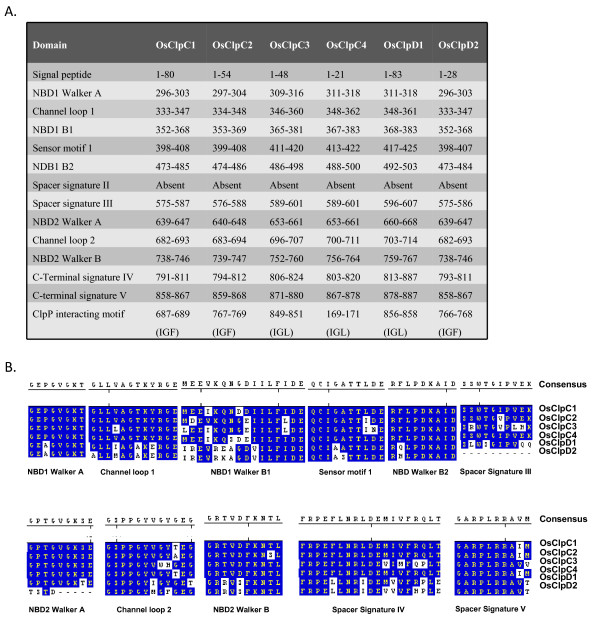
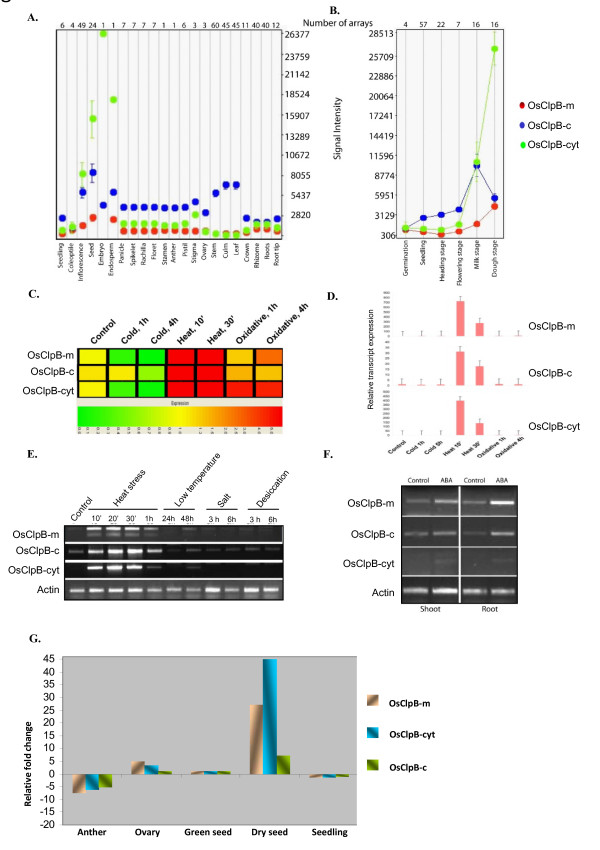
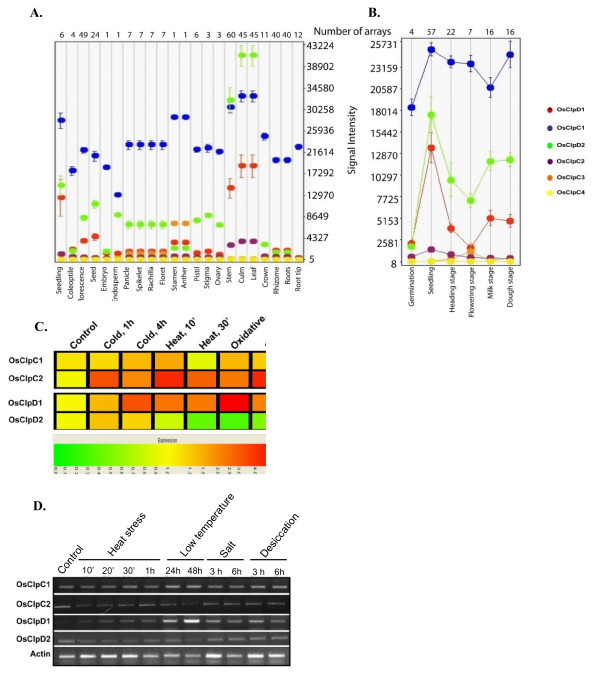
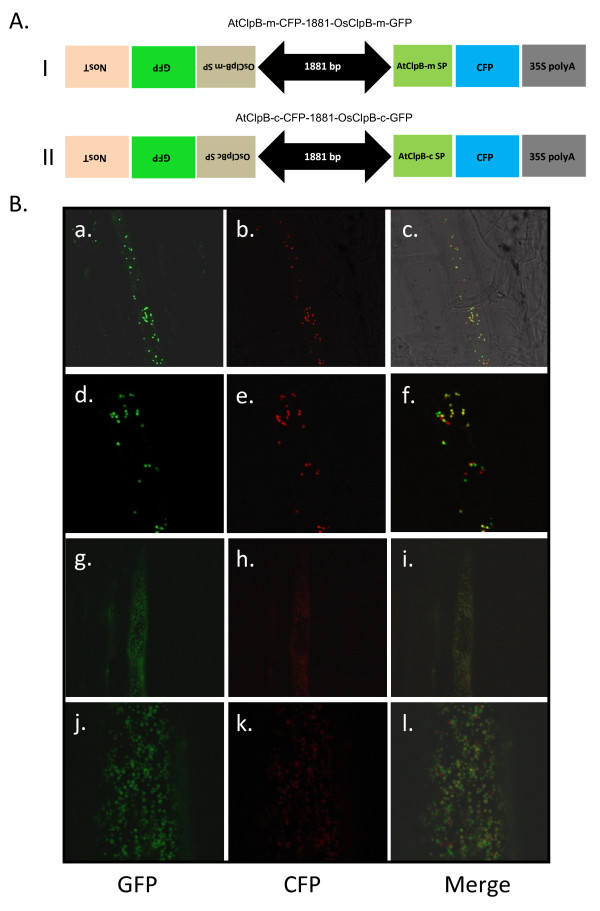
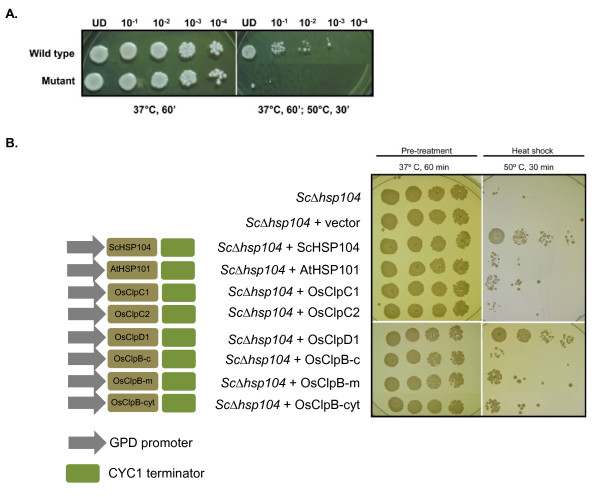
Results: Nine ORFs were noted to constitute rice class I Clp ATPases in the following manner: 3 ClpB proteins (ClpB-cyt, Os05g44340; ClpB-m, Os02g08490; ClpB-c, Os03g31300), 4 ClpC proteins (ClpC1, Os04g32560; ClpC2, Os12g12580; ClpC3, Os11g16590; ClpC4, Os11g16770) and 2 ClpD proteins (ClpD1, Os02g32520; ClpD2, Os04g33210). Using the respective signal sequences cloned upstream to GFP/CFP reporter proteins and transient expression studies with onion epidermal cells, evidence is provided that rice ClpB-m and Clp-c proteins are indeed localized to their respective cell locations mitochondria and chloroplasts, respectively. Associated with their diverse cell locations, domain structures of OsClpB-c, OsClpB-m and OsClpB-cyt proteins are noted to possess a high-level conservation. OsClpB-cyt transcript is shown to be enriched at milk and dough stages of seed development. While expression of OsClpB-m was significantly less as compared to its cytoplasmic and chloroplastic counterparts in different tissues, this transcript showed highest heat-induced expression amongst the 3 ClpB proteins. OsClpC1 and OsClpC2 are predicted to be chloroplast-localized as is the case with all known plant ClpC proteins. However, the fact that OsClpC3 protein appears mitochondrial/chloroplastic with equal probability and OsClpC4 a plasma membrane protein reflects functional diversity of this class. Different class I Clp ATPase transcripts were noted to be cross-induced by a host of different abiotic stress conditions. Complementation assays of Deltahsp104 mutant yeast cells showed that OsClpB-cyt, OsClpB-m, OsClpC1 and OsClpD1 have significantly positive effects. Remarkably, OsClpD1 gene imparted appreciably high level tolerance to the mutant yeast cells.

Conclusions: Rice class I Clp ATPase gene family is constituted of 9 members. Of these 9, only 3 belonging to ClpB group are heat stress regulated. Distribution of ClpB proteins to different cell organelles indicates that their functioning might be critical in different cell locations. From the complementation assays, OsClpD1 appears to be more effective than OsClpB-cyt protein in rescuing the thermosensitive defect of the yeast ScDeltahsp104 mutant cells.


Figures

Figure 1
Figure 1
Phylogenetic relatedness among different class I Clp ATPase proteins from rice, Arabidopsis and Populus. The phylogenetic tree was created using ClustalX 1.83, based on the predicted amino acid sequences. The branch lengths are proportional to divergence, with the scale of 0.1 representing 10% change.
Figure 2
Figure 2
A. Relative positions of different domains present in rice class I ClpB proteins. The position of amino acids was marked manually after aligning the sequences in MegAlign module of DNASTAR. B. Consensus sequence of the different domains present in rice class I ClpB proteins. Alignments were done using ClustalV of MegAlign module of DNASTAR and alignment pictures were modified for representation.
Figure 3
Figure 3
A. Relative positions of domains in rice ClpC and ClpD proteins. B. Consensus sequence of the different domains present in rice ClpC and ClpD proteins. Alignments were done using ClustalV of MegAlign module of DNASTAR and alignment pictures were modified for representation.
Figure 4
Figure 4
Expression analysis of ClpB genes in various stages of rice plant based on the microarrays performed for rice. A. Expression of OsClpB genes in different parts of rice plants. B. Expression of OsClpB genes during developmental stages. In silico analysis shown in A and B was performed using the Genevestigator database. The analysis included data from a total of 166 array experiments, and included 28 different tissues, organs or growth stages. C. Expression analysis of rice class I Clp ATPase transcripts in response to cold, heat and oxidative stresses. Hierarchical cluster display of expression profiles for OsClpB genes showing differential expression in rice (color bar represents the log2 expression values; green color representing low level expression, yellow shows medium level expression and red signifies the high level expression). D. Q-PCR analysis of the transcript expression of ClpB-cyt, ClpB-c and ClpB-m genes. The bars represent transcript level fold change values with respect to unstressed 10-d-old seedlings. Standard errors of the biological replicates are shown as error bars. E. Semi-quantitative RT-PCR based transcript expression analysis of rice ClpB genes under different stress conditions. The following stress conditions were used; HS: heat shock treatment (45°C; 10', 20', 30' and 1 h). LT: low temperature stress (8 ± 2°C; 24 h and 48 h). SS: NaCl stress (150 mM; 3 h and 6 h). DS: PEG treatment (12% PEG8000; 3 h and 6 h). PCR was performed for 25 cycles and products were resolved on 1% agarose gel. F. Semi-quantitative RT-PCR based transcript expression analysis of rice ClpB genes upon application of 100 μM ABA. PCR was performed for 25 cycles and products were resolved on 1% agarose gel.
Figure 5
Figure 5
Expression analysis of class I Clp ATPase genes in different parts of rice plant based on the microarrays performed for rice. A. Expression pattern of OsClpC and OsClpD transcripts in different parts of rice. B. Expression pattern of OsClpC and OsClpD transcripts in different developmental stages of rice. In silico analysis shown in A and B was performed using the Genevestigator database. The analysis included data from a total of 166 array experiments, and included 28 different tissues, organs or growth stages. C. Expression analysis of rice Clp ATPase transcripts in response to cold, heat and oxidative stresses. Hierarchical cluster display of expression profile for rice ClpC and ClpD genes showing differential expression in rice (color bar represents the log2 expression values; green color representing low level expression, yellow shows medium level expression and red signifies the high level expression). D. Semi-quantitative RT-PCR of rice ClpC and ClpD genes under different stress conditions. The following stress conditions were used; HS: heat shock treatment (45°C; 10', 20', 30' and 1 h). LT: low temperature stress (8 ± 2°C; 24 h and 48 h). SS: NaCl stress (150 mM; 3 h and 6 h). DS: PEG treatment (12% PEG8000; 3 h and 6 h). PCR was performed for 25 cycles and products were resolved on 1% agarose gel.
Figure 6
Figure 6
A. Schematic representation of the constructs used for transient transformation of onion epidermal cells. Panel I shows the AtClpB-m-CFP-1881-OsClpB-m-GFP construct while Panel II shows the AtClpB-c-CFP-1881-OsClpB-c-GFP construct. B. Organellar localization of OsClpB-c and OsClpB-m proteins in transiently transformed onion epidermal cells. a, d: OsClpB-c::GFP (d is enlarged view of a section of a); b, e: AtClpB-c::CFP (e is enlarged view of a section of b); c, f: OsClpB-c::GFP and AtClpB-c::CFP merged (f is enlarged view of a section of c). g, j: OsClpB-m::GFP (j is enlarged view of a section of g); h, k: AtClpB-m::CFP (k is enlarged view of a section of h); i, l: merged OsClpB-m::GFP and AtClpB-m::CFP (l is enlarged view of a section of i). CFP is shown in red for optimal image depiction.
Figure 7
Figure 7
A. Thermotolerance assay of S. cerevisiae (wild type) and ScΔhsp104 mutant cells. B. Complementation analysis of yeast Δhsp104 mutant with various Clp ATPase genes. Left panel shows schematic representation of the different constructs used to transform ScΔhsp104 mutant cells and right panel shows thermotolerance assays with the transformed yeast cells.

References

    1. Peng S, Huang J, Sheehy JE, Laza RC, Visperas RM, Zhong X, Centeno GS, Khush GS, Cassman KG. Rice yields decline with higher night temperature from global warming. Proc Natl Acad Sci. 2004;101(27):9971–9975. doi: 10.1073/pnas.0403720101. - DOI - PMC - PubMed
    1. Grover A, Chandramouli A, Agarwal S, Katiyar-Agarwal S, Agarwal M, Sahi C. In: Rice Improvement in the Genomic Era. Dutta SK, editor. Hawarth Press USA; 2009. Transgenic rice for tolerance against abiotic stresses; pp. 237–267.
    1. Singh A, Grover A. Genetic engineering for heat tolerance in plants. Physiol Mol Biol Plants. 2008;14:155–166. doi: 10.1007/s12298-008-0014-2. - DOI - PMC - PubMed
    1. Frank G, Pressman E, Ophir R, Althan L, Shaked R, Freedman M, Shen S, Firon N. Transcriptional profiling of maturing tomato (Solanum lycopersicum L.) microspores reveals the involvement of heat shock proteins, ROS scavengers, hormones, and sugars in the heat stress response. Journal of Experimental Botany. 2009;60(13):3891–3908. doi: 10.1093/jxb/erp234. - DOI - PMC - PubMed
    1. IRGSP. The map-based sequence of the rice genome. Nature. 2005;436(7052):793–800. doi: 10.1038/nature03895. - DOI - PubMed

Publication types

MeSH terms

LinkOut - more resources