

Single protein molecule mapping with magnetic atomic force microscopy
- PMID: 20141762
- PMCID: PMC2814202
- DOI: 10.1016/j.bpj.2009.10.021
Single protein molecule mapping with magnetic atomic force microscopy
Abstract
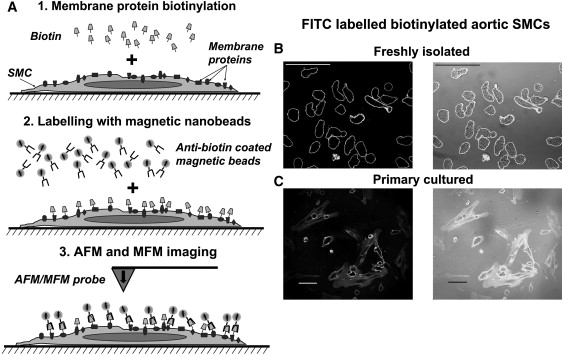
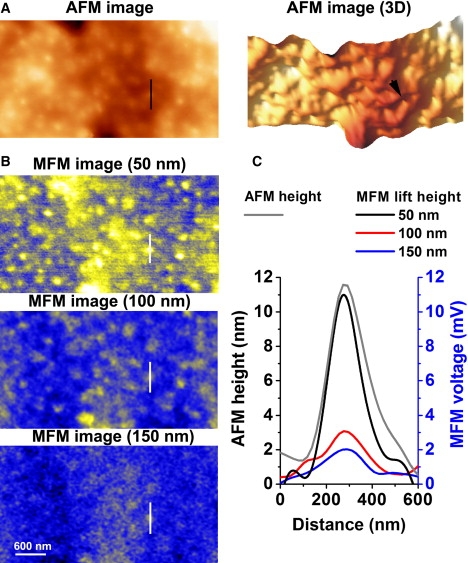
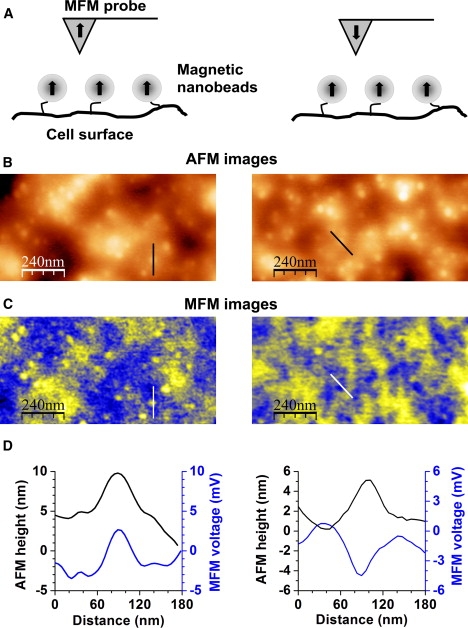
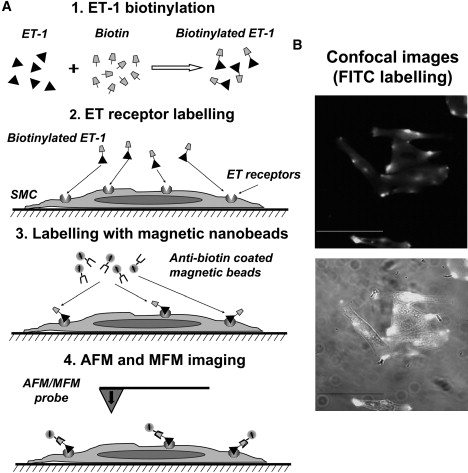
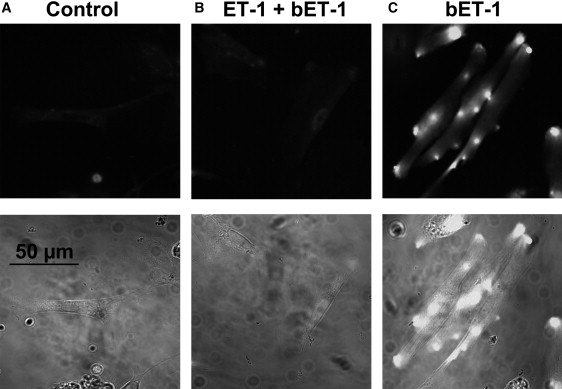
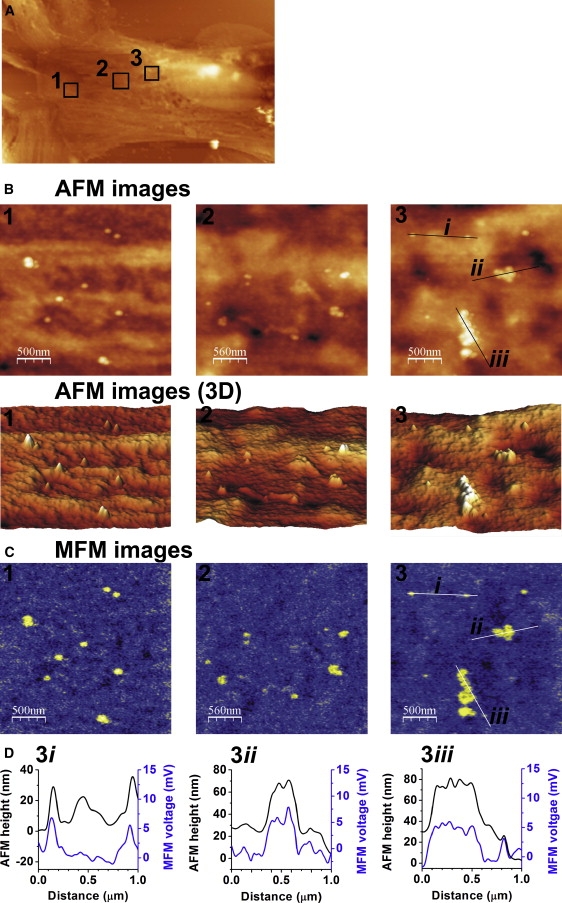
Understanding the structural organization and distribution of proteins in biological cells is of fundamental importance in biomedical research. The use of conventional fluorescent microscopy for this purpose is limited due to its relatively low spatial resolution compared to the size of a single protein molecule. Atomic force microscopy (AFM), on the other hand, allows one to achieve single-protein resolution by scanning the cell surface using a specialized ligand-coated AFM tip. However, because this method relies on short-range interactions, it is limited to the detection of binding sites that are directly accessible to the AFM tip. We developed a method based on magnetic (long-range) interactions and applied it to investigate the structural organization and distribution of endothelin receptors on the surface of smooth muscle cells. Endothelin receptors were labeled with 50-nm superparamagnetic microbeads and then imaged with magnetic AFM. Considering its high spatial resolution and ability to "see" magnetically labeled proteins at a distance of up to 150 nm, this approach may become an important tool for investigating the dynamics of individual proteins both on the cell membrane and in the submembrane space.
Copyright (c) 2010 Biophysical Society. Published by Elsevier Inc. All rights reserved.
Figures
Similar articles
-
Integration of confocal and atomic force microscopy images.J Neurosci Methods. 2009 Feb 15;177(1):94-107. doi: 10.1016/j.jneumeth.2008.09.034. Epub 2008 Oct 18. J Neurosci Methods. 2009. PMID: 18996410
-
High-speed near-field fluorescence microscopy combined with high-speed atomic force microscopy for biological studies.Biochim Biophys Acta Gen Subj. 2020 Feb;1864(2):129325. doi: 10.1016/j.bbagen.2019.03.011. Epub 2019 Mar 16. Biochim Biophys Acta Gen Subj. 2020. PMID: 30890438
-
Combining confocal and atomic force microscopy to quantify single-virus binding to mammalian cell surfaces.Nat Protoc. 2017 Nov;12(11):2275-2292. doi: 10.1038/nprot.2017.112. Epub 2017 Oct 5. Nat Protoc. 2017. PMID: 28981124
-
Single-molecule imaging of cell surfaces using near-field nanoscopy.Acc Chem Res. 2012 Mar 20;45(3):327-36. doi: 10.1021/ar2001167. Epub 2011 Oct 12. Acc Chem Res. 2012. PMID: 21992025 Review.
-
High-speed atomic force microscopy: imaging and force spectroscopy.FEBS Lett. 2014 Oct 1;588(19):3631-8. doi: 10.1016/j.febslet.2014.06.028. Epub 2014 Jun 14. FEBS Lett. 2014. PMID: 24937145 Review.
Cited by
-
Magnetic force microscopy: quantitative issues in biomaterials.Biomatter. 2014;4:e29507. doi: 10.4161/biom.29507. Epub 2014 Jul 22. Biomatter. 2014. PMID: 25050758 Free PMC article.
-
The applications of atomic force microscopy to vision science.Invest Ophthalmol Vis Sci. 2010 Dec;51(12):6083-94. doi: 10.1167/iovs.10-5470. Invest Ophthalmol Vis Sci. 2010. PMID: 21123767 Free PMC article. Review.
References
-
- Giepmans B.N., Adams S.R., Tsien R.Y. The fluorescent toolbox for assessing protein location and function. Science. 2006;312:217–224. - PubMed
-
- Zhang J., Campbell R.E., Tsien R.Y. Creating new fluorescent probes for cell biology. Nat. Rev. Mol. Cell Biol. 2002;3:906–918. - PubMed
-
- Bruchez M.P. Turning all the lights on: quantum dots in cellular assays. Curr. Opin. Chem. Biol. 2005;9:533–537. - PubMed
-
- Lewis A., Taha H., Ammann E. Near-field optics: from subwavelength illumination to nanometric shadowing. Nat. Biotechnol. 2003;21:1378–1386. - PubMed
Publication types
MeSH terms
Substances
LinkOut - more resources
Full Text Sources
Other Literature Sources
Medical
Miscellaneous
