. 2010 Jan 22;140(2):280-93.
doi: 10.1016/j.cell.2009.12.041.

The histone deacetylase Sirt6 regulates glucose homeostasis via Hif1alpha

Affiliations

The histone deacetylase Sirt6 regulates glucose homeostasis via Hif1alpha

Lei Zhong et al. Cell. .

Abstract

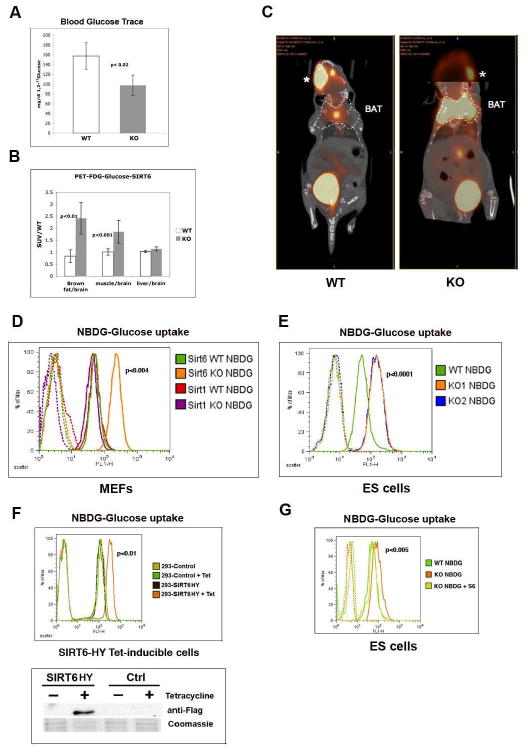
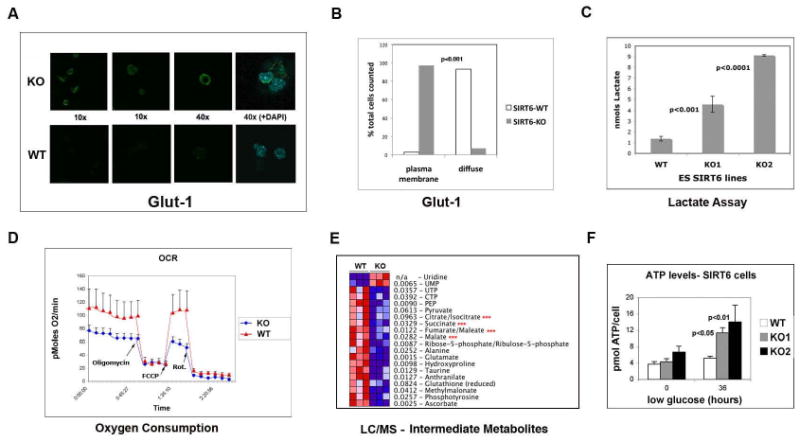
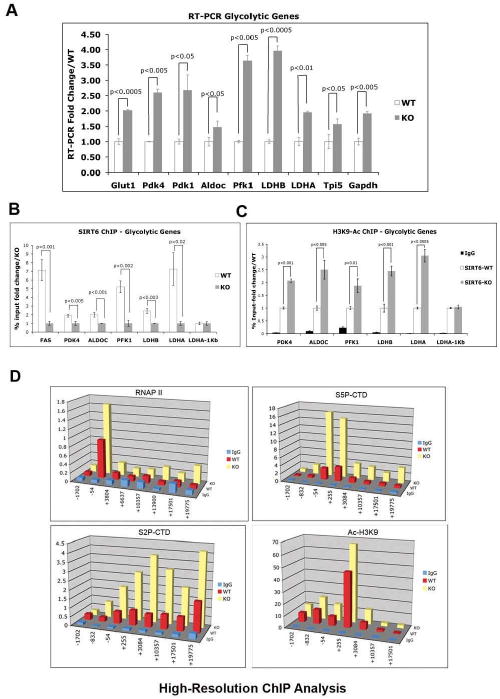
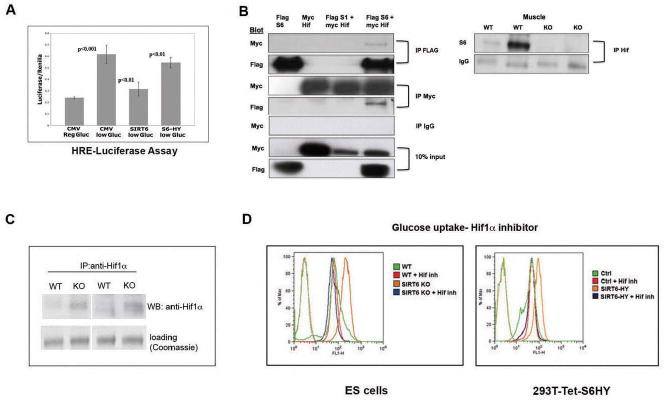
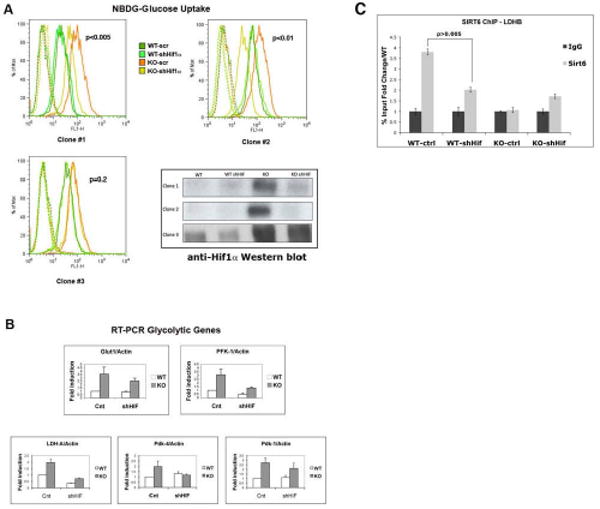
SIRT6 is a member of a highly conserved family of NAD(+)-dependent deacetylases with various roles in metabolism, stress resistance, and life span. SIRT6-deficient mice develop normally but succumb to a lethal hypoglycemia early in life; however, the mechanism underlying this hypoglycemia remained unclear. Here, we demonstrate that SIRT6 functions as a histone H3K9 deacetylase to control the expression of multiple glycolytic genes. Specifically, SIRT6 appears to function as a corepressor of the transcription factor Hif1alpha, a critical regulator of nutrient stress responses. Consistent with this notion, SIRT6-deficient cells exhibit increased Hif1alpha activity and show increased glucose uptake with upregulation of glycolysis and diminished mitochondrial respiration. Our studies uncover a role for the chromatin factor SIRT6 as a master regulator of glucose homeostasis and may provide the basis for novel therapeutic approaches against metabolic diseases, such as diabetes and obesity.


Figures

Figure 1
Figure 1. Increased glucose uptake in SIRT6 deficient cells and mice
(A) [1,2 13C] labeled glucose trace assay was carried out on 16 days-old SIRT6 wild-type (WT) and knock-out (KO) mice. See Methods for details. (B) Standard Uptake Value (SUV) ratio of labeled 18FDG-Glucose incorporation in WT and KO SIRT6 mice. The different tissues analyzed are indicated. Samples were normalized against brain, which exhibit stable glucose uptake across genotypes. The experiment is an average of three mice per genotype. (C) 16-days old SIRT6 WT and KO mice were PET imaged 60 minutes following i.v. injection of 18F-glucose. Dotted lines indicate position of the brown adipose tissue (BAT). *: labeled glucose at site of injection (retro-orbital; the enhanced signal observed in the WT reflects the position of the head at this particular CT section; comparable intensity is observed in the KO on a different CT section). (D) SIRT6 WT and SIRT6 KO mouse embryonic fibroblasts (MEFs) together with SIRT1 WT and KO MEFs were grown in the presence of the fluorescent glucose analog NBDG (Invitrogen) for 1 hr., and glucose uptake was then quantified using flow cytometry (FACS). Dotted lines are controls without the fluorescent NBDG glucose analog. (E) One WT and two independently generated SIRT6 KO ES lines (KO1 and KO2) were treated as in (D), and analyzed by FACS. (F) 293T cells were stable transfected with a SIRT6 cDNA carrying a H133Y mutation (SIRT6HY) that acts as a dominant negative, under the control of the Tetracycline promoter. Lower panel: western blot showing that SIRT6 was induced specifically after tetracycline treatment (SIRT6). Empty vector was used as a control (Ctrl). Upper panel: glucose uptake was measured as in (D). (G) SIRT6 KO cells were infected with a SIRT6 expressing-lentivirus. Infected cells were sorted for GFP expression, and following expansion, cells were assayed for glucose uptake following 1 hr. incubation with NBDG. See also Figure S1.
Figure 2
Figure 2. Increased lactate production and decreased oxygen consumption in SIRT6 deficient cells
(A) Confocal immunostaining in SIRT6 WT and KO ES cells using a GLUT1 antibody. (B) Quantification of GLUT1 membrane staining in SIRT6 WT and KO cells. (C) Lactate levels in SIRT6 WT and KO ES cells (KO1 and KO2). (D) Oxygen consumption in live SIRT6 WT and KO ES cells under basal conditions, following the addition of the mitochondrial F1-F0-ATPase inhibitor oligomycin (μM), the uncoupler FCCP (1 μM) and the Complex I inhibitor rotenone (rot)(5μM) in combination with the Complex I inhibitor myxothiazol (5μM). Oxygen consumption rate (OCR) was measured using the XF24 SeaHorse Analyzer (Seahorse Bioscience). Each data point is the average of five independent measurements. Error bars indicate standard error of the mean (E) Protein lysates were purified from three independent samples of WT and KO ES cells and glucose metabolites were analyzed by liquid chromatography-mass spectrometry (LC-MS). Red asterisks: TCA intermediate metabolites. (F) ATP levels were measured using the ATP Assay Kit (SIGMA) in SIRT6 WT and KO ES cells (KO1 and KO2) that were either in regular media or in low glucose (0.5 g/L) media for 36 hours. See also Figure S2.
Figure 3
Figure 3. SIRT6 directly inhibits expression of glycolytic genes functioning as an H3K9 deacetylase
(A) RNA was purified from SIRT6 WT and KO ES cells and real-time PCR (RT-PCR) was performed with primers specific for the indicated genes. Three independent samples were averaged, keeping a threshold of 0.4 as confidence value in the threshold cycle (Ct). Values were normalized against actin. (B) Chromatin immunoprecipitation (ChIP) assays using an antibody against SIRT6 were performed on samples from SIRT6 WT and KO ES cells. Real-time PCR were carried out using primers specific for the promoter regions of the indicated glycolytic genes, except for LDHA-1kb, where primers lying 1kb downstream of the 3′ UTR of the LDHA gene were used, and served as a negative control. (C) ChIP assays were performed as described in (B), with an anti H3K9 acetylated antibody (Abcam). The LDHA-1Kb primers were used as a negative control. (D) High resolution ChIP analysis was performed in the LDHB locus using antibodies against total RNA Polymerase II (RNAP II), phosphorylated Serine 5 form of RNAP II (S5P-CTD), phosphorylated Serine 2 form of RNAP II (S2P-CTD), and acetylated H3 lysine 9. Error bars in all graphs indicate the standard error of the mean. See also Figures S3 and S4.
Figure 4
Figure 4. SIRT6 is a co-repressor of Hif1α
(A) A luciferase reporter gene under the regulation of 3 tandem copies of Hypoxia-Responsive Elements (HRE) was co-transfected with empty vector (CMV), SIRT6 (S6) or SIRT6-HY (catalytic dead) plasmids into 293T cells, and subjected to low-glucose (5mM) conditions for 24 hr. Extracts were analyzed for Luciferase activity. (B) Left panel: A Flag control, a SIRT6-Flag or a SIRT1-Flag proteins were either expressed alone or co-expressed with Hif1α-Myc in 293T cells, and following immunoprecipitation (IP) with either a Flag, a Myc, or an IgG antibody, extracts were analyzed by Western blot, and probed with the indicated antibodies. Right Panel: lysates were prepared from SIRT6 WT and KO muscle, and following IP with anti-Hif1α antibody, extracts were analyzed by western blot probed with anti-SIRT6 antibody. The IgG band is shown as loading control. (C) Lysates were prepared from SIRT6 WT or KO ES cells, followed by IP and western blot with a Hif1α antibody. (D) ES cells (left panel) or 293T cells stably expressing a tetracycline inducible SIRT6 dominant negative allele (S6HY)(right panel) were treated with or without the Hif1α inhibitor #77 (Zimmer et al., 2008) and glucose uptake was measured by FACS, following 1 hr. exposure to NBDG. See also Figure S5.
Figure 5
Figure 5. Knocking down Hif1α completely rescues the metabolic phenotype in SIRT6 deficient cells
(A) SIRT6 WT and KO ES cells were infected with either a Hif1α-knockdown lentivirus (shHiflα) or vector alone (scr). Independent clones were expanded, and glucose uptake was measured using NBDG, as described before. Lower right panel: Western blot analysis of the different clones with an anti-Hif1α antibody. Note that clone #3 failed to down-regulate Hif1α, and thus it served as an internal control. (B) RNA was purified from Hif1α-KD clones and glycolytic gene expression levels were examined by RT-PCR. The different analyzed genes are indicated. Fold induction was normalized against actin. Three independent samples were averaged, keeping a threshold of 0.4 as confidence value in the threshold cycle (Ct). Error bars in all graphs indicate the standard error of the mean. (C) Hif1α recruits SIRT6 to the glycolytic promoters. ChIP was performed on wild-type control (WT-ctrl) and Hif1α knock-down cells (WT-shHif) with an antibody against SIRT6. Real-time PCR were carried out using primers specific for the promoter region of the LDHB gene. SIR6 KO cells were used as negative controls in the ChIP assay.
Figure 6
Figure 6. Increased Hif1α stability and protein synthesis in SIRT6 deficient cells
(A) RNA was purified from SIRT6 WT and KO ES cells and Hif1α expression was analyzed by RT-PCR using primers specific for the mRNA of Hif1α. Results are shown as the mean±SEM (n=6). (B) Upper panel: Lysates were prepared from SIRT6 WT or KO ES cells, followed by IP and western blot with a Hif1α antibody. Samples were either left untreated, or treated with the Hif1α stabilizer CoCl2 (150μM) for 24 hr. prior to lysate preparation. Lower panel: quantitative densitometric analysis of Hif1α levels from the upper panel blot. (C) Wild type (WT) and SIRT6 deficient (KO) cells were co-transfected with an empty 5′UTR-Luc vector or Hif1α- 5′UTR-Luciferase reporters and shifted 6hrs post-transfection to no glucose-hypoxia conditions for 24hrs for measurement of luciferase activity. (D) Polysome profile analysis of WT and Sirt6 deficient (KO) ES cells. lower panel : WT and KO cells were treated with cycloheximide (CHX) for 10 minutes before collection. The lysates were processed for polysome analysis by velocity sedimentation on sucrose gradients. Gradients were fractionated by scanning at 254 nm, and the resulting absorbance profiles are shown with sedimentation from left to right. Upper panel: Quantitative RT-PCR was performed to assess distribution of HIF1α mRNA. See also Figure S6.
Figure 7
Figure 7. Hif1α-dependent increased glycolysis and lactate production in SIRT6 deficient mice
(A) Lysates were prepared from muscles of 4 littermate-pairs of SIRT6 WT and KO mice. Western analysis was carried out with antibodies against the indicated proteins. Tubulin was used as a loading control. (B) Immunostaining with a GLUT1 antibody (green) was carried out on muscles and brain from SIRT6 WT and KO mice. Nuclei were stained with DAPI (blue). Images were taken using a confocal microscope with constant laser beam for all images (KR: 39.8; IRIS: 2.0). (C) Serum was purified from SIRT6 WT and KO mice, and lactate was measured using the Lactate Assay Kit (BioVision). Error bars indicate the standard error of the mean. n=4 for each genotype. (D) A Hif1α small molecule inhibitor rescues the glucose phenotype in SIRT6 deficient mice. Hif1α inhibitor #77 (20μg/g weight) was injected i.p. in 19 days-old wild type and SIRT6 KO mice, and 30 min later blood was withdrawn for glucose measurement. 5% DMSO (dilution solution) was injected as control. (E) Model. Under normal nutrient conditions, SIRT6 inhibits expression of glycolytic genes acting as an histone deacetylase to co-repress Hif1α. This maintains proper flux of glucose to the TCA cycle. Under conditions of nutrient stress, SIRT6 is inactivated, allowing activation of Hif1α, recruitment of p300, acetylation of H3K9 at the promoters and increased expression of multiple metabolic genes, causing increased glycolysis and decreased mitochondrial respiration. See also Figure S7.

References

    1. Aragones J, Fraisl P, Baes M, Carmeliet P. Oxygen sensors at the crossroad of metabolism. Cell metabolism. 2009;9:11–22. - PubMed
    1. Arany Z, Huang LE, Eckner R, Bhattacharya S, Jiang C, Goldberg MA, Bunn HF, Livingston DM. An essential role for p300/CBP in the cellular response to hypoxia. Proceedings of the National Academy of Sciences of the United States of America. 1996;93:12969–12973. - PMC - PubMed
    1. Arnesen T, Kong X, Evjenth R, Gromyko D, Varhaug JE, Lin Z, Sang N, Caro J, Lillehaug JR. Interaction between HIF-1 alpha (ODD) and hARD1 does not induce acetylation and destabilization of HIF-1 alpha. FEBS letters. 2005;579:6428–6432. - PMC - PubMed
    1. Barzilai N, Bartke A. Biological approaches to mechanistically understand the healthy life span extension achieved by calorie restriction and modulation of hormones. J Gerontol A Biol Sci Med Sci. 2009;64:187–191. - PMC - PubMed
    1. Bassing CH, Chua KF, Sekiguchi J, Suh H, Whitlow SR, Fleming JC, Monroe BC, Ciccone DN, Yan C, Vlasakova K, et al. Increased ionizing radiation sensitivity and genomic instability in the absence of histone H2AX. Proceedings of the National Academy of Sciences of the United States of America. 2002;99:8173–8178. - PMC - PubMed

Publication types