. 2010 Feb 3;11(2):125-35.
doi: 10.1016/j.cmet.2010.01.003.

A macrophage sterol-responsive network linked to atherogenesis

Affiliations

A macrophage sterol-responsive network linked to atherogenesis

Lev Becker et al. Cell Metab. .

Abstract

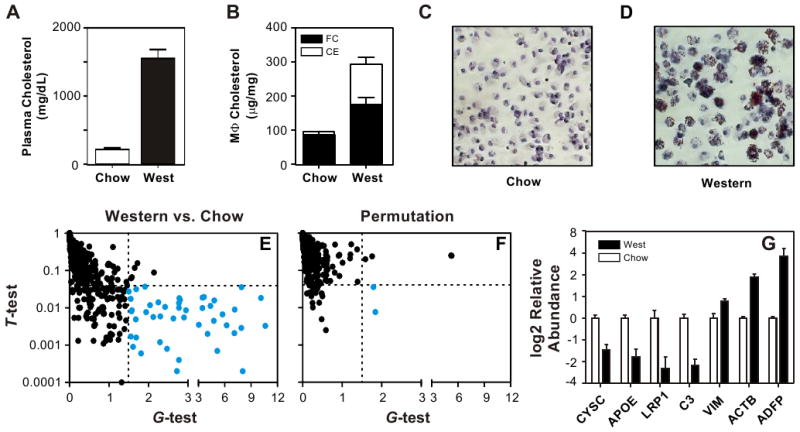
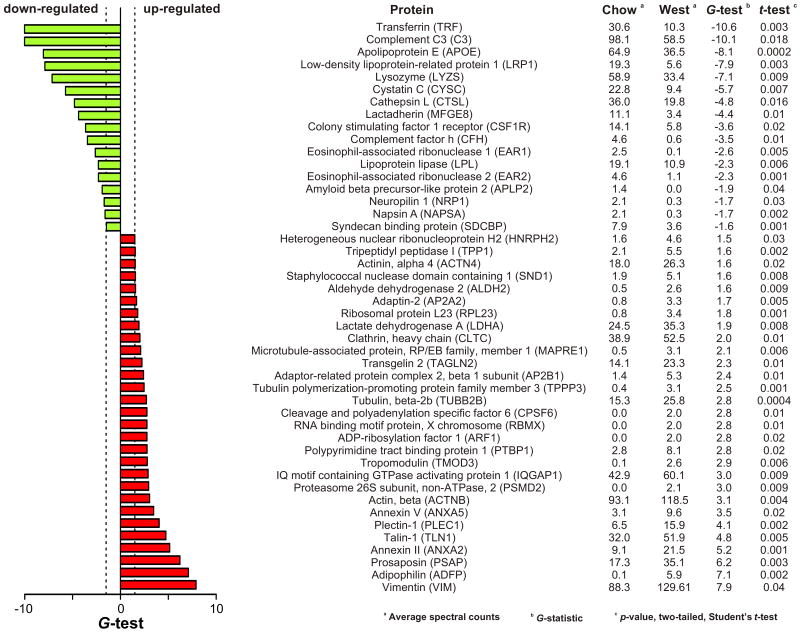
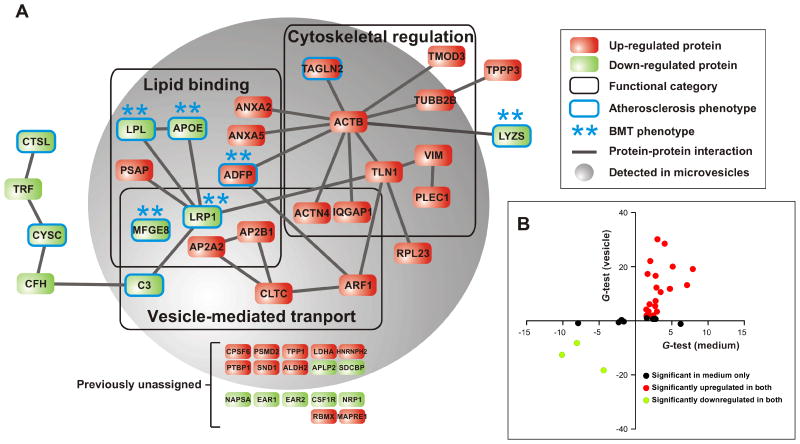
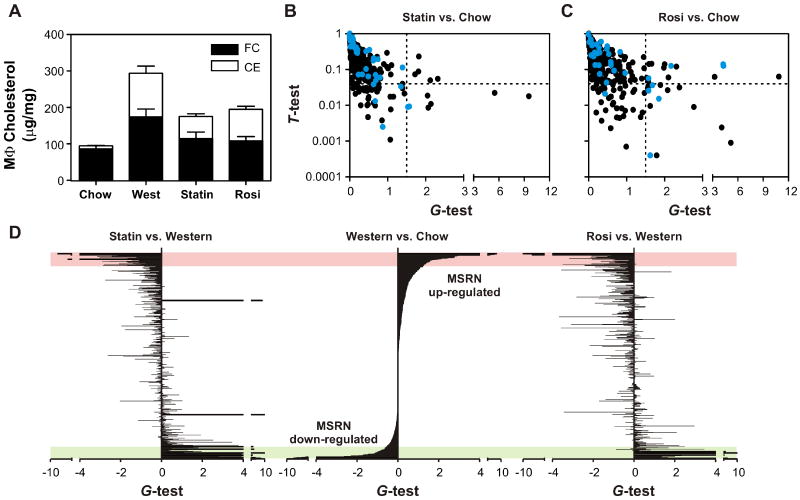
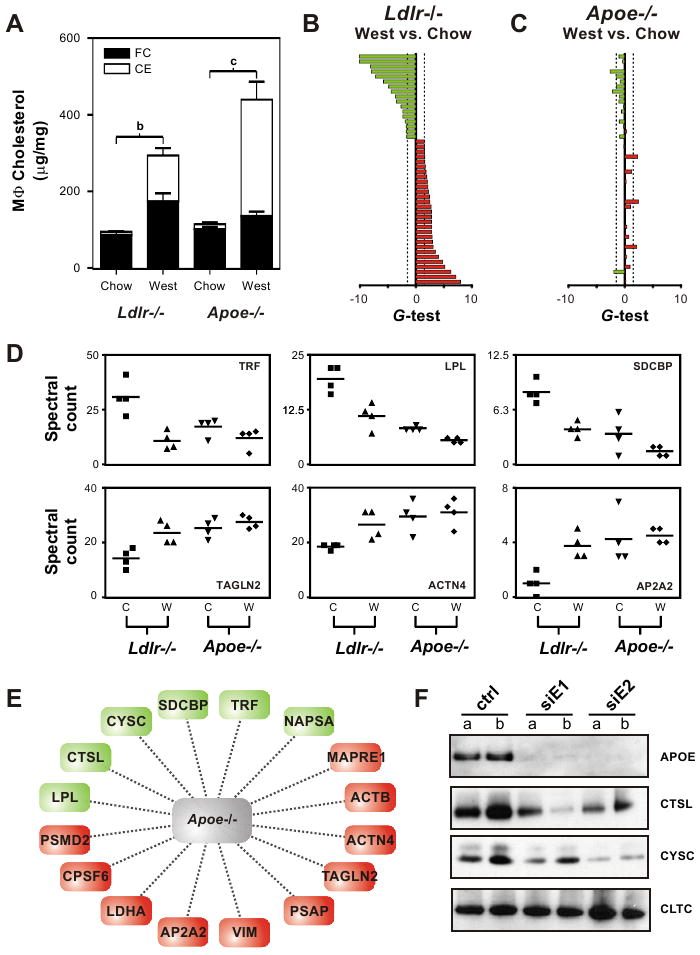
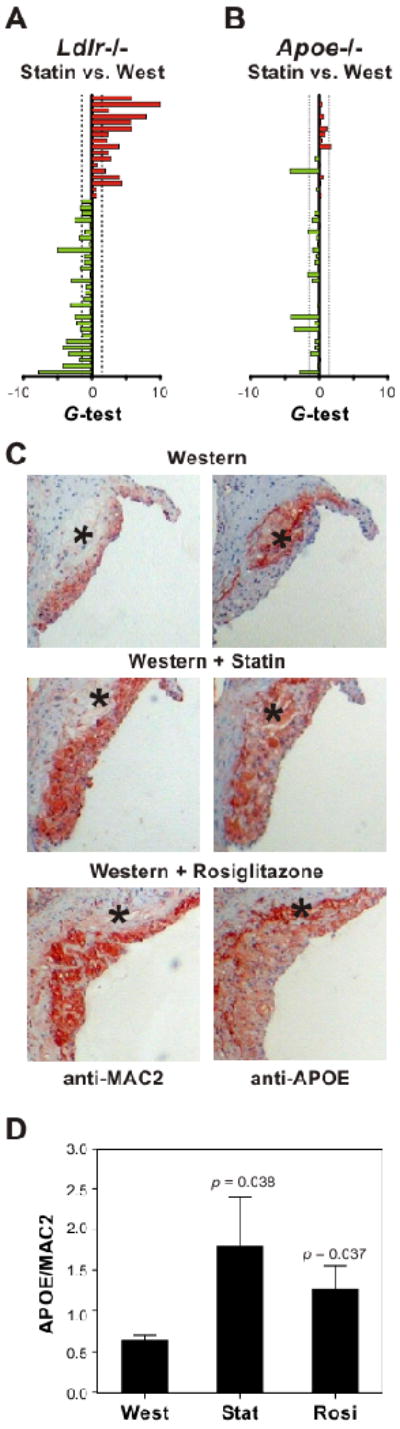
Cholesteryl ester accumulation by macrophages is a critical early event in atherogenesis. To test the hypothesis that sterol loading promotes foam cell formation and vascular disease by perturbing a network of interacting proteins, we used a global approach to identify proteins that are differentially expressed when macrophages are loaded with cholesterol in vivo. Our analysis revealed a sterol-responsive network that is highly enriched in proteins with known physical interactions, established roles in vesicular transport, and demonstrated atherosclerotic phenotypes in mice. Pharmacologic intervention with a statin or rosiglitazone and use of mice deficient in LDL receptor or apolipoprotein E implicated the network in atherosclerosis. Biochemical fractionation revealed that most of the sterol-responsive proteins resided in microvesicles, providing a physical basis for the network's functional and biochemical properties. These observations identify a highly integrated network of proteins whose expression is influenced by environmental, genetic, and pharmacological factors implicated in atherogenesis.


Figures

Figure 1
Figure 1. Proteomics analysis of conditioned medium harvested from control and sterol-loaded macrophages
Macrophages were isolated from the peritoneum of male Ldlr-/- mice fed a chow (low fat) or Western (high fat) diet for 14 weeks. Panel A: Plasma cholesterol levels. Panel B: Macrophage (Mϕ) cholesterol levels. FC, free cholesterol; CE, cholesteryl ester. Panels C,D: Oil-red O staining of macrophages. Panel E: Medium conditioned by macrophages isolated from mice fed a chow or Western diet was digested with trypsin and analyzed by LC-ESI-MS/MS. Proteins were quantified by the total number of unique peptides (spectral counts) detected by MS/MS. Confidence intervals (dotted lines; G>1.5 and α=0.04) and the FDR were established by permutation analysis. Proteins differing in relative abundance between control and foam cells (blue ●) were identified as those that exhibited a significant difference in the total number of peptides, as assessed by both the t-test (p-value) and G-test (G-test). Panel F: Representative example of a randomly selected permutation analysis (false positive result, blue ●). Panel G: Biochemical validation of differential protein expression by macrophage foam cells. Equal amounts of protein from medium conditioned by control cells or foam cells were subjected to SDS-PAGE, using 4%–12% gradient gels. Proteins were transferred to PVDF membranes, and probed with antibodies raised against murine CYSC, APOE, C3, VIM, ACTB, LRP1, or ADFP. Immunoblots were quantified by densitometry and statistical significance was assessed using a two-tailed, Student's t-test. Results are means and standard deviations. See also Table S1.
Figure 2
Figure 2. Proteins differentially expressed by macrophage foam cells
Proteins differing in relative abundance in the conditioned medium of control and foam cells were identified as described in the legend to Fig. 1. A positive or negative value for the G-test indicates an increased or decreased level of protein expression relative to the control. See also Table S1.
Figure 3
Figure 3. The macrophage sterol-responsive network (MSRN)
Panel A: A protein–protein interaction network was constructed, using the 46 proteins that were differentially expressed (upregulated, red; downregulated, green) by macrophage foam cells isolated from Ldlr-/- mice. GO analysis of the network revealed modules enriched in proteins implicated in lipid binding, cytoskeletal regulation, and vesicle-mediated transport (p=0.01, 0.001 and 0.003, respectively; Fisher's exact test with Benjamini-Hochberg correction). Proteins that associate with an atherosclerotic phenotype (circled in blue) in genetically engineered mice or with myeloid specific expression/deletion as assessed by bone marrow transplantation (BMT, **) were identified with PubMatrix. Note that 10 of 16 sterol-responsive proteins that were not previously shown to interact physically or functionally with other MSRN proteins, termed previously unassigned, reside in the microvesicle fraction. Panel B: Comparison of MSRN protein expression in media and isolated microvesicles. A positive or negative value for the G-test indicates an increased or decreased level of protein expression relative to the control. See also Table S2.
Figure 4
Figure 4. Impact of anti-atherosclerotic interventions on the MSRN
Ldlr-/- mice were fed a Western diet for 14 weeks with or without simvastatin (Statin) or rosiglitazone (Rosi) for the final 2 weeks. Panel A: Macrophage (Mϕ) cholesterol levels; FC, free cholesterol; CE, cholesteryl ester. Results are means and standard deviations. Panels B,C: Differentially expressed proteins of macrophages isolated from Ldlr-/- mice fed a chow diet vs. simvastatin-treated (Panel B) or rosiglitazone-treated (Panel C) Ldlr-/- mice fed a Western diet. Proteins identified as differentially expressed by macrophages isolated from chow and Western diet-fed mice (Fig. 1e) are shown in blue. Panel D: Relative abundance of proteins detected in conditioned media of macrophages was assessed by the G-test. Results represent chow vs. Western diet (center axis), Western diet plus statin vs. Western diet (left axis), or Western diet plus rosiglitazone vs. Western diet (right axis). A positive or negative value for the G-test indicates an increased or decreased level of protein expression in the first sample relative to the second. Proteins in all panels are sorted in descending order based on G-test values of the Western vs. chow diets (center axis). Bars at the same vertical level correspond to the same protein. Red and green areas highlight proteins that reside in the MSRN. See also Table S1.
Figure 5
Figure 5. Role of APOE in regulation of the MSRN
Macrophages were isolated from the peritoneum of Ldlr-/- or Apoe-/- mice fed a chow or Western diet for 14 weeks. Panel A: Macrophage cholesterol (MϕC) levels. FC; free cholesterol; CE, cholesteryl ester. Panels B,C: Differential expression of MSRN proteins. Red, increased protein level; green, decreased protein level. Proteins are in the same order, top to bottom, as in Fig. 2. Panel B: Ldlr-/- macrophages, chow vs. Western diet. Panel C: Apoe-/- macrophages, chow vs. Western diet. Panel D: Quantification of MSRN proteins by LC-ESI-MS/MS and spectral counting of macrophages harvested from Ldlr-/- or Apoe-/- mice fed a chow (C) or Western (W) diet for 14 weeks. Panel E: Subset of MSRN proteins that are dysregulated in macrophages harvested from Apoe-/- mice fed a low-fat diet. Panel F: Immunoblot analysis of conditioned medium of macrophages harvested from C57BL/6J mice and treated with siRNA to APOE. See also Figure S3.
Figure 6
Figure 6. APOE expression in atherosclerotic lesions of Ldlr-/- mice
Ldlr-/- or Apoe-/- mice were fed a Western diet for 14 weeks or a Western diet plus simvastatin (Statin) or rosiglitazone (Rosi) for the final 2 weeks of the regimen. Panels A,B: Differential expression of MSRN proteins by macrophages isolated from statin-treated Ldlr-/- or Apoe-/- mice fed a Western diet. Red, increased protein level; green, decreased protein level. Proteins are in the same order, top to bottom, as in Fig. 2. Panel C: Immunohistochemical staining of aortic sinus sections isolated from Ldlr-/- mice on the different regimens. Adjacent sections were immunostained with antibodies to APOE or MAC2 (a macrophage marker). *, necrotic core. Images, 10×. Panel D: Quantification of immunohistochemical staining for APOE and MAC2. Results (N=5 per group) are means and standard deviations. See also Figure S5.

Similar articles

Cited by

References

    1. Ait-Oufella H, Kinugawa K, Zoll J, Simon T, Boddaert J, Heeneman S, Blanc-Brude O, Barateau V, Potteaux S, Merval R, et al. Lactadherin deficiency leads to apoptotic cell accumulation and accelerated atherosclerosis in mice. Circulation. 2007;115:2168–2177. - PubMed
    1. Babaev VR, Patel MB, Semenkovich CF, Fazio S, Linton MF. Macrophage lipoprotein lipase promotes foam cell formation and atherosclerosis in low density lipoprotein receptor-deficient mice. J Biol Chem. 2000;275:26293–26299. - PubMed
    1. Becker KG, Hosack DA, Dennis G, Jr, Lempicki RA, Bright TJ, Cheadle C, Engel J. PubMatrix: a tool for multiplex literature mining. BMC Bioinformatics. 2003;4:61. - PMC - PubMed
    1. Bellosta S, Mahley RW, Sanan DA, Murata J, Newland DL, Taylor JM, Pitas RE. Macrophage-specific expression of human apolipoprotein E reduces atherosclerosis in hypercholesterolemic apolipoprotein E-null mice. J Clin Invest. 1995;96:2170–2179. - PMC - PubMed
    1. Bengtsson E, To F, Håkansson K, Grubb A, Brånén L, Nilsson J, Jovinge S. Lack of the cysteine protease inhibitor cystatin C promotes atherosclerosis in apolipoprotein E-deficient mice. Arterioscler Thromb Vasc Biol. 2005;25:2151–2156. - PubMed

Publication types

MeSH terms