. 2010 Feb 3;11(2):136-46.
doi: 10.1016/j.cmet.2009.12.009.

FoxO-mediated defense against oxidative stress in osteoblasts is indispensable for skeletal homeostasis in mice

Affiliations

FoxO-mediated defense against oxidative stress in osteoblasts is indispensable for skeletal homeostasis in mice

Elena Ambrogini et al. Cell Metab. .

Abstract

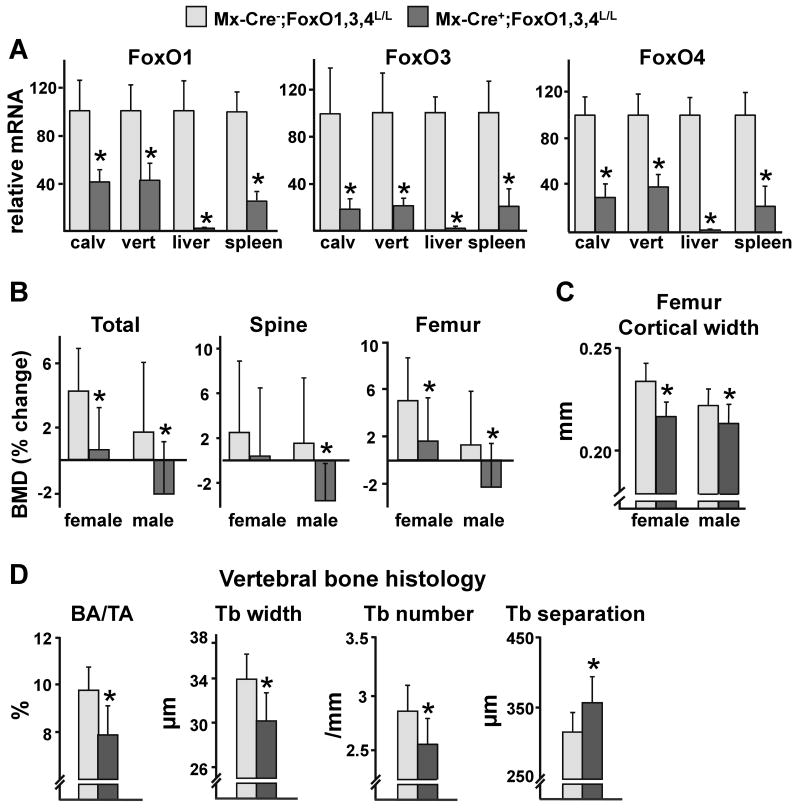
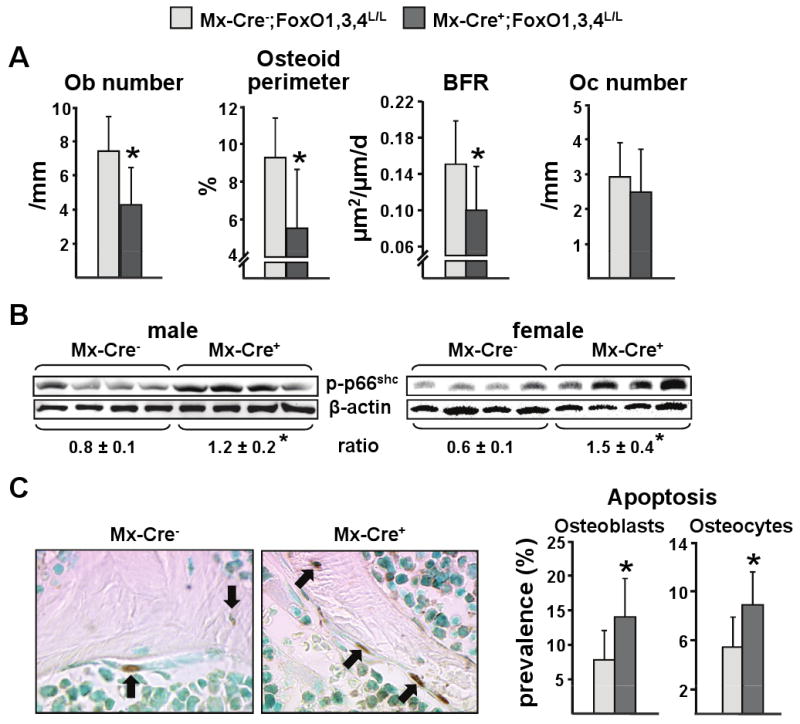
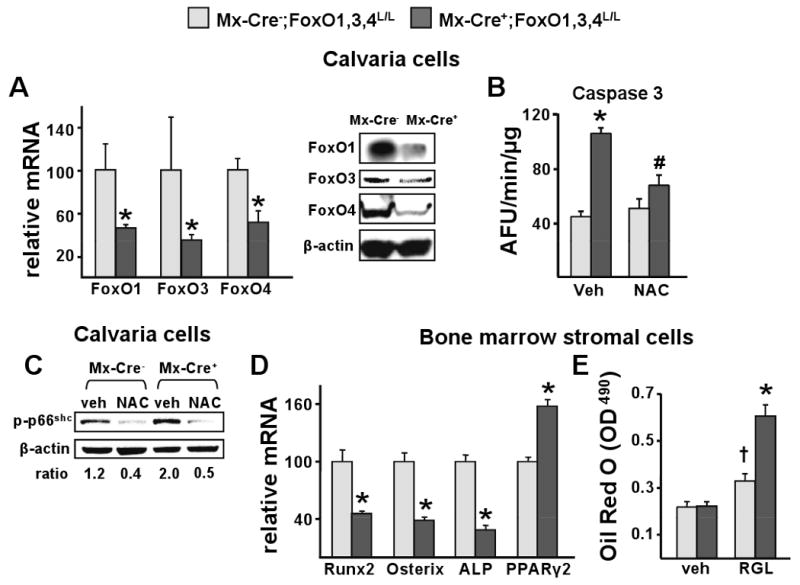
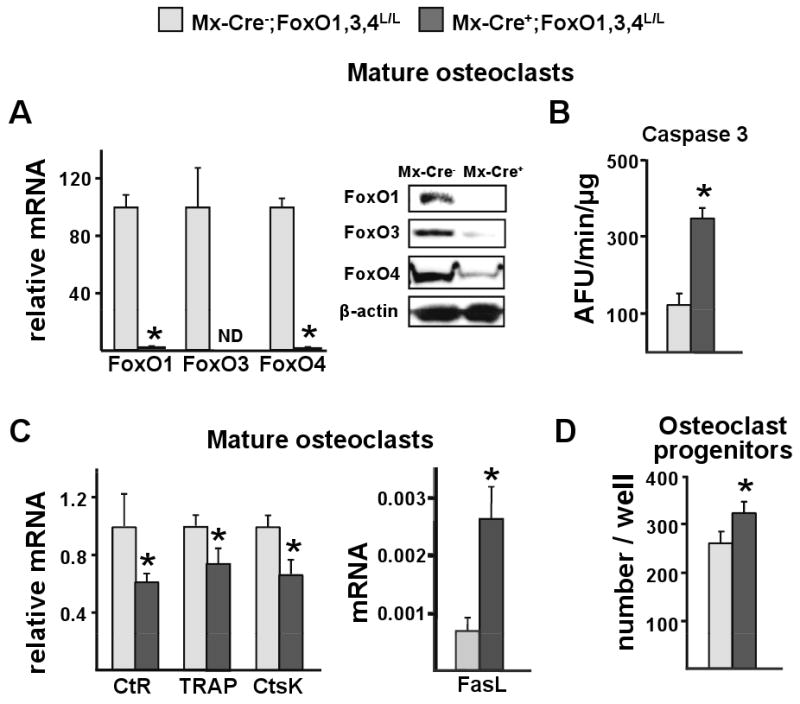
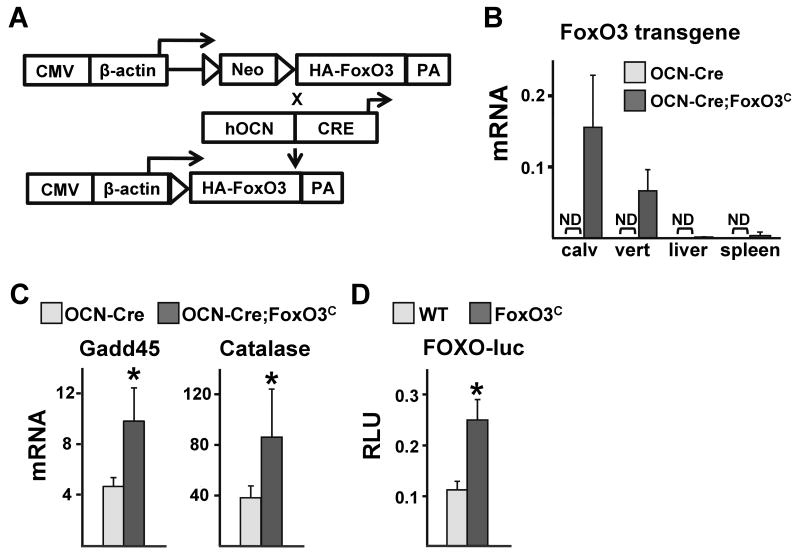
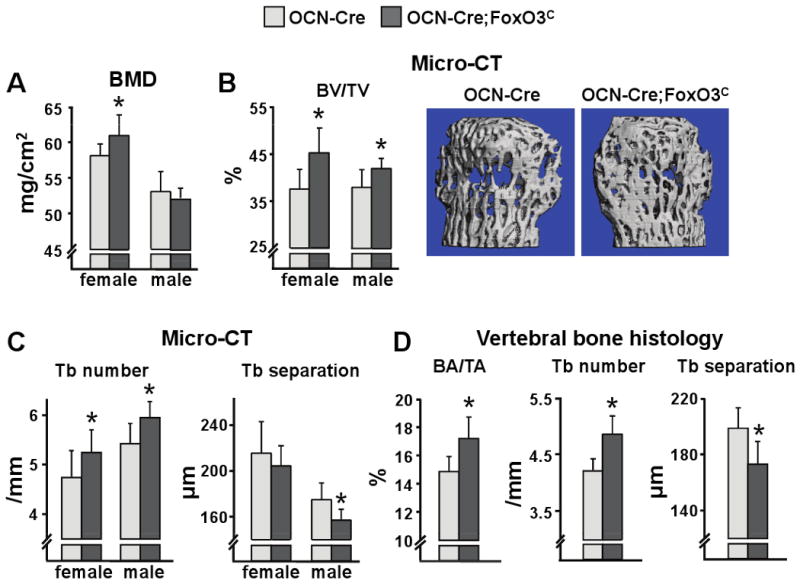
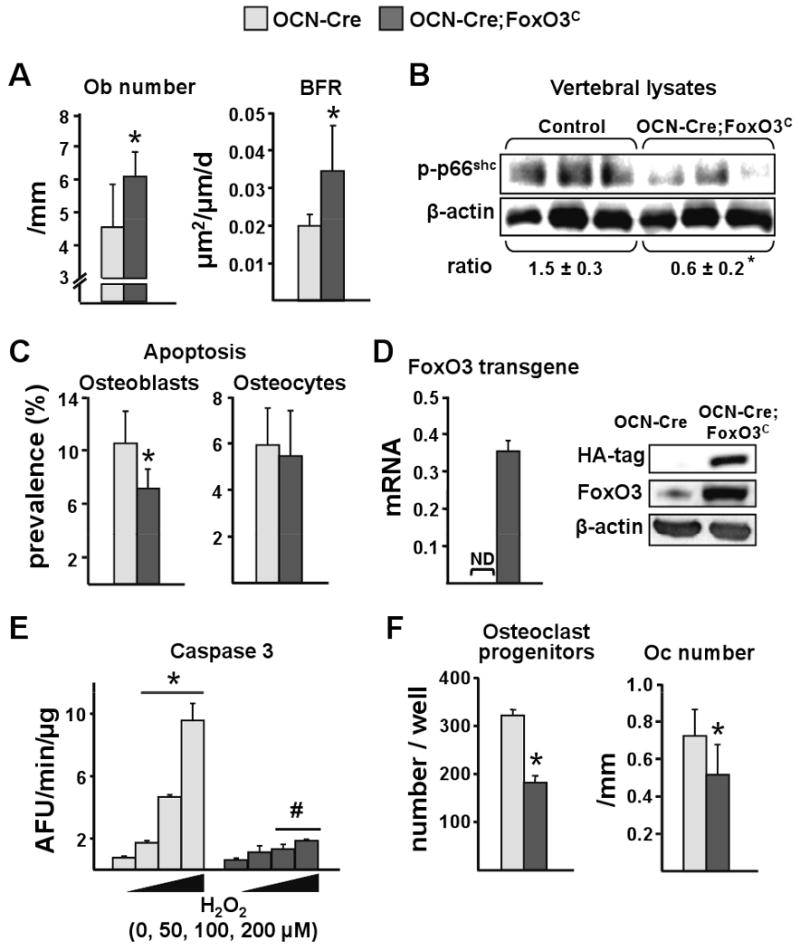
Aging increases oxidative stress and osteoblast apoptosis and decreases bone mass, whereas forkhead box O (FoxO) transcription factors defend against oxidative stress by activating genes involved in free radical scavenging and apoptosis. Conditional deletion of FoxO1, FoxO3, and FoxO4 in 3-month-old mice resulted in an increase in oxidative stress in bone and osteoblast apoptosis and a decrease in the number of osteoblasts, the rate of bone formation, and bone mass at cancellous and cortical sites. The effect of the deletion on osteoblast apoptosis was cell autonomous and resulted from oxidative stress. Conversely, overexpression of a FoxO3 transgene in mature osteoblasts decreased oxidative stress and osteoblast apoptosis and increased osteoblast number, bone formation rate, and vertebral bone mass. We conclude that FoxO-dependent oxidative defense provides a mechanism to handle the oxygen free radicals constantly generated by the aerobic metabolism of osteoblasts and is thereby indispensable for bone mass homeostasis.


Figures

Figure 1
Figure 1. Bone Mass is Decreased Following FoxOs Deletion
(A-D) 12 wk-old female and male mice were injected with pI-pC and sacrificed 5 wk later. (A) mRNA levels of FoxOs in calvaria (calv), vertebra (vert), liver or spleen from male mice determined by qRT-PCR (n=8 mice/group). (B) BMDs determined by DEXA 1 d before and 5 wk following pI-pC injections (n=10-17 mice/group). *p<0.05 vs respective Mx-Cre- by Student's t-test (C) Cortical width measured by micro-CT in femurs (n=10-17 mice/group). *p<0.05 vs respective Mx-Cre- by Student's t-test (D) Histomorphometric analysis of longitudinal undecalcified sections of L1-L3 vertebrae of male mice (n=6-7 mice/group). BA/TA=bone area per tissue area; Tb=trabecular. *p<0.05 by Student's t-test.
Figure 2
Figure 2. Deletion of FoxOs Increases Oxidative Stress and Decreases Bone Formation
(A-C) Measurements were made using bone from the animals described in Figure 2. (A) Histomorphometric analysis of longitudinal undecalcified sections of L1-L3 vertebrae of male mice (n=6-7 mice/group). Ob=osteoblast; Oc=osteoclast. (B) p66shc phosphorylation determined by Western blot in vertebral lysates; each lane represents one animal. The mean ratio ± SD of phosphorylated p66shc to β-actin is depicted numerically at the bottom of the corresponding blots. (C) Osteoblasts and osteocyte apoptosis in sections of the same mice as in A. In the photomicrographs apoptotic osteocytes and osteoblasts (stained brown by ISEL, original magnification ×630) are indicated by the arrows (n=7-8 mice/group). *p<0.05 by Student's t-test.
Figure 3
Figure 3. ROS-Induced Apoptosis is Increased in Osteoblastic Cells from FoxO-Deleted Mice
(A-D) Cells were obtained from the mice described in figure 2. (A) mRNA levels of FoxOs by qRT-PCR and protein levels of FoxOs by Western Blot in calvaria-derived osteoblastic cells cultured for 8 d. *p<0.05 by Student's t-test. (B) Caspase 3 activity in cells described in A, cultured in the presence of vehicle or NAC (1 mM) for 24 h. *p<0.05 vs veh in Mx-Cre-, # p<0.05 vs veh in Mx-Cre+ by ANOVA. (C) p66shc phosphorylation determined by western blot in lysates from calvaria cells described in B. The ratio of phosphorylated p66shc to β-actin is depicted numerically at the bottom of the corresponding blots. (D) mRNA levels of the indicated genes in bone marrow-derived stromal cells cultured for 8 d. *p<0.05 by Student's t-test (E) Bone marrow-derived stromal cells were treated with vehicle or rosiglitazone (RGL; 5 nM/ml) for 11 days. Lipid was visualized with Oil Red O and quantified as described in Methods. *p<0.05 vs RGL in Mx-Cre-, †p<0.05 vs vehicle in Mx-Cre- by ANOVA.
Figure 4
Figure 4. Osteoclast Progenitor Number and Mature Osteoclast Apoptosis are Increased Following FoxOs Deletion
(A-D) Cells were obtained from the mice described in figure 2. (A) mRNA levels of FoxOs by qRT-PCR and protein levels of FoxOs by Western Blot in mature osteoclasts generated from non-adherent bone marrow cells cultured with M-CSF and RANKL for 5 d; ND=not detected. (B) Caspase 3 activity and (C) mRNA levels of the indicated genes in cells described in A. CtR=calcitonin receptor; CtsK=cathepsin K. (D) Number of TRAP positive cells generated from bone marrow cells cultured with M-CSF and RANKL for 6 d. TRAP=tartrate-resistant acid phosphatase. *p<0.05 by Student's t-test.
Figure 5
Figure 5. Generation of FoxO3C Transgenic Mice
(A) Mice harboring a transgene consisting of a transcriptional/translational stop cassette, flanked by loxP sites, inserted between the broadly-expressed hybrid CMV-chicken β-actin promoter and a cDNA encoding an HA-tagged human FoxO3 WT, designated FoxO3C mice were crossed with mice expressing the Cre recombinase under the control of the OCN promoter. The loxP-flanked stop cassette is removed only in cells expressing Cre resulting in FoxO3 expression in that cell type. PA=polyadenilation site. (B) mRNA levels of the FoxO3 transgene in calvaria, vertebra (L5), liver and spleen of 4 wk-old mice determined by qRT-PCR (n=3 mice/group); ND=not detected. (C) mRNA levels of the indicated FoxO-target genes in calvaria from 4 wk-old mice (n=3 mice/group). (D) Calvaria-derived osteoblastic cells isolated from newborn FoxO3C and WT littermates infected with Ad-Cre for FoxO3 overexpression and transfected with a FoxO-luc reporter construct. Luc activity was measured 24 h later. *p<0.05 by Student's t-test.
Figure 6
Figure 6. Overexpression of FoxO3 in Osteoblasts Increases Vertebral Bone Mass
(A) Spine BMD by DEXA and (B-C) micro-CT measurements in the vertebra (L5) of 16 wk-old mice (n=7-14 mice/group). BV/TV=bone volume per total volume; Tb=trabecular. Representative images of vertebral cancellous bone are shown. *p<0.05 vs respective OCN-Cre by Student's t-test (D) Histomorphometric analysis of longitudinal undecalcified sections of L1-L3 vertebrae of 16 wk-old male mice (n=6 mice/group). *p<0.05 by Student's t-test. BA/TA=bone area per tissue area.
Figure 7
Figure 7. Overexpression of FoxO3 in Osteoblasts Protects Against Oxidative Stress-Induced Apoptosis
(A-C) Measurements were made using bones from the animals described in Figure 6. (A) Histomorphometric analysis of longitudinal undecalcified sections of L1-L3 vertebrae of male mice (n=7 mice/group). Ob=osteoblasts; BFR=bone formation rate. (B) p66shc phosphorylation determined by Western blot in vertebral lysates; each lane represents one animal. The mean ratio ± SD of phosphorylated p66shc to β-actin is depicted numerically at the bottom of the corresponding blots. (C) Osteoblasts and osteocyte apoptosis in sections of the same mice as in A. (D) mRNA levels of FoxO3 transgene by qRT-PCR and protein levels of HA-FoxO3 and Foxo3 by Western blot in bone marrow-derived osteoblastic cells cultured for 18 d with ascorbic acid. (E) Caspase 3 activity in cells described in D, cultured in the presence of vehicle or H2O2 at the indicated concentrations for 16 h. *p<0.05 vs no H2O2 by ANOVA. #p<0.05 vs respective H2O2 dose in OCN-Cre by Student's t-test. (F) Left panel: number of TRAP positive cells generated from bone marrow cells cultured with M-CSF and RANKL for 6 d. Right panel: osteoclast number was determined in the same sections as in A. TRAP=tartrate-resistant acid phosphatase; Oc=osteoclast. *p<0.05 by Student's t-test.

Similar articles

Cited by

References

    1. Adler AS, Sinha S, Kawahara TL, Zhang JY, Segal E, Chang HY. Motif module map reveals enforcement of aging by continual NF-kappaB activity. Genes Dev. 2007;21:3244–3257. - PMC - PubMed
    1. Akune T, Ohba S, Kamekura S, Yamaguchi M, Chung UI, Kubota N, Terauchi Y, Harada Y, Azuma Y, Nakamura K, Kadowaki T, Kawaguchi H. PPARgamma insufficiency enhances osteogenesis through osteoblast formation from bone marrow progenitors. J Clin Invest. 2004;113:846–855. - PMC - PubMed
    1. Almeida M, Ambrogini E, Han L, Manolagas SC, Jilka RL. Increased lipid oxidation causes oxidative stress, increased PPAR{gamma} expression and diminished pro-osteogenic Wnt signaling in the skeleton. J Biol Chem. 2009a;284:27438–27448. - PMC - PubMed
    1. Almeida M, Han L, Martin-Millan M, O'Brien CA, Manolagas SC. Oxidative stress antagonizes Wnt signaling in osteoblast precursors by diverting beta-catenin from T cell factor- to forkhead box O-mediated transcription. J Biol Chem. 2007a;282:27298–27305. - PubMed
    1. Almeida M, Han L, Martin-Millan M, Plotkin LI, Stewart SA, Roberson PK, Kousteni S, O'Brien CA, Bellido T, Parfitt AM, Weinstein RS, Jilka RL, Manolagas SC. Skeletal involution by age-associated oxidative stress and its acceleration by loss of sex steroids. J Biol Chem. 2007b;282:27285–27297. - PMC - PubMed

Publication types