. 2010 Apr 1;588(Pt 7):1039-56.
doi: 10.1113/jphysiol.2009.178988. Epub 2010 Feb 8.

In vivo long-term synaptic plasticity of glial cells

Affiliations

In vivo long-term synaptic plasticity of glial cells

Eve-Lyne Bélair et al. J Physiol. .

Abstract

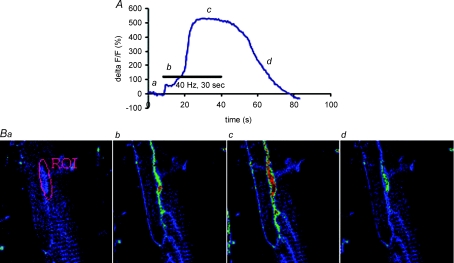
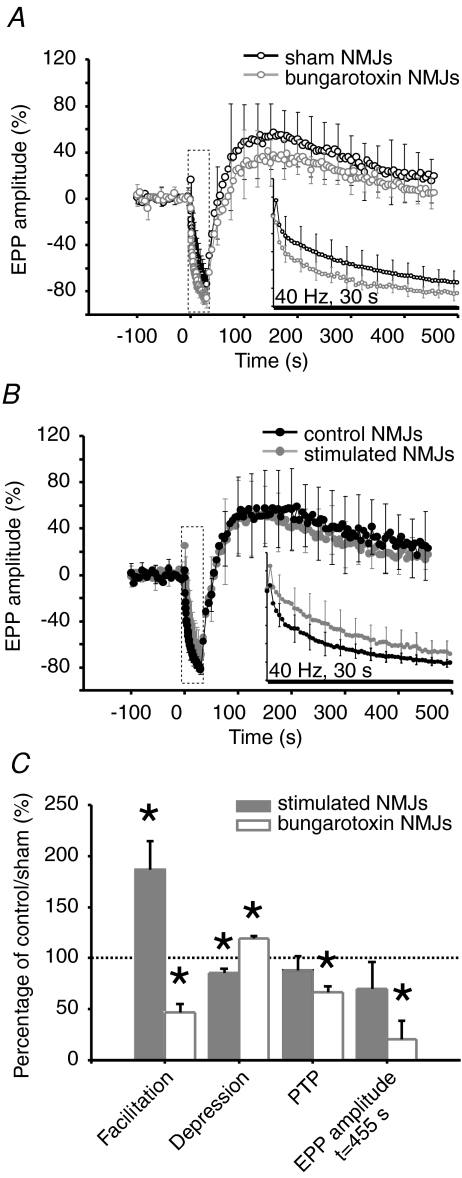
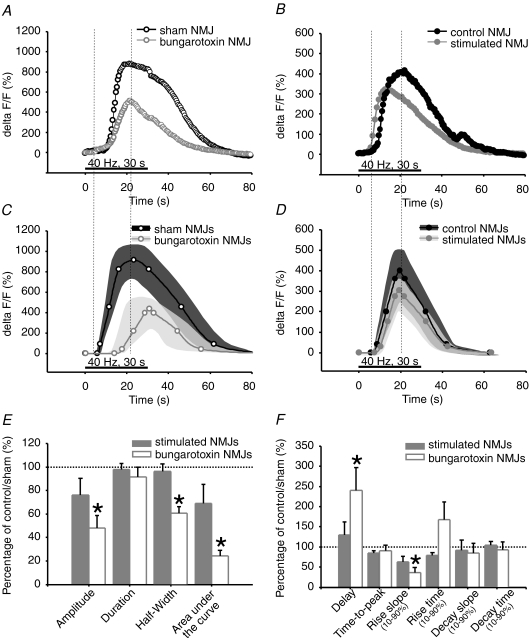
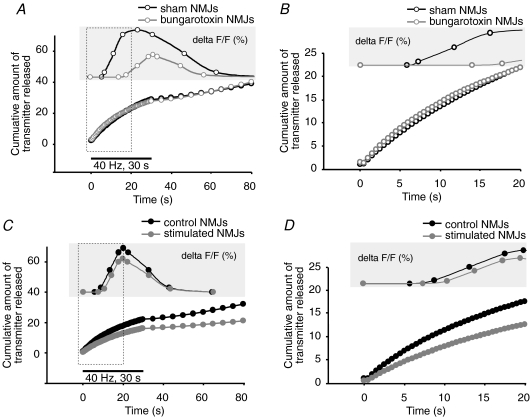
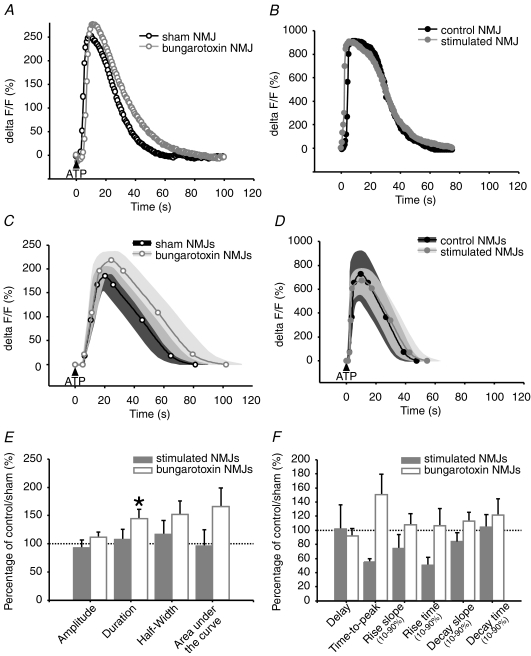
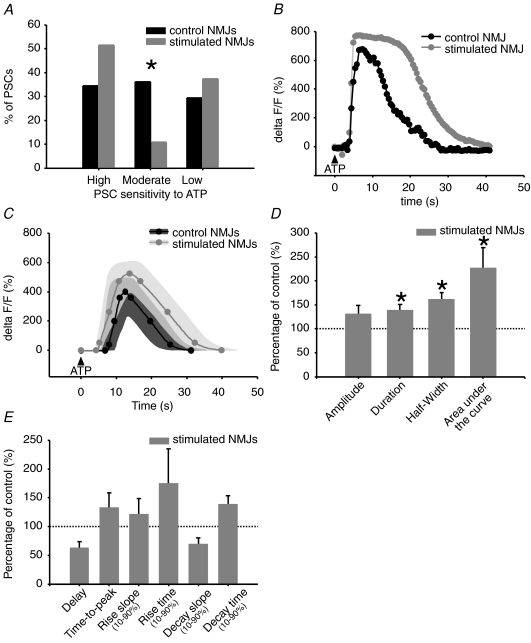
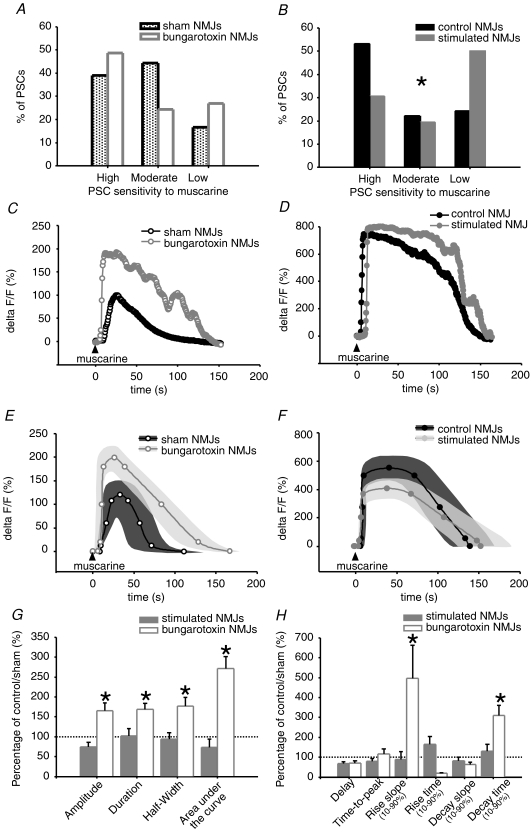
Evidence showing the ability of glial cells to detect, respond to and modulate synaptic transmission and plasticity has contributed to the notion of glial cells as active synaptic partners. However, synaptically induced plasticity of glia themselves remains ill defined. Here we used the amphibian neuromuscular junction (NMJ) to study plasticity of perisynaptic Schwann cells (PSCs), glial cells at this synapse, following long-term in vivo modifications of synaptic activity. We used two models that altered synaptic activity in different manners. First, chronic blockade of postsynaptic nicotinic receptors using alpha-bungarotoxin (alpha-BTx) decreased facilitation, increased synaptic depression and decreased post-tetanic potentiation (PTP). Second, chronic nerve stimulation increased facilitation and resistance to synaptic depression, while leaving PTP unaltered. Our results indicate that there is no direct relationship between transmitter release and PSC calcium responses. Indeed, despite changes in transmitter release and plasticity in stimulated NMJs, nerve-evoked PSC calcium responses were similar to control. Similarly, PSC calcium responses in alpha-BTx treated NMJs were delayed and smaller in amplitude, even though basal level of transmitter release was increased. Also, when isolating purinergic and muscarinic components of PSC calcium responses, we found an increased sensitivity to ATP and a decreased sensitivity to muscarine in chronically stimulated NMJs. Conversely, in alpha-BTx treated NMJs, PSC sensitivity remained unaffected, but ATP- and muscarine-induced calcium responses were prolonged. Thus, our results reveal complex modifications of PSC properties, with differential modulation of signalling pathways that might underlie receptor regulation or changes in Ca(2+) handling. Importantly, similar to neurons, perisynaptic glial cells undergo plastic changes induced by altered synaptic activity.


Figures

Figure 1
Figure 1
Measurements of PSC Ca2+ responses at the amphibian NMJ A, typical Ca2+ response evoked in a PSC by sustained motor nerve stimulation is shown (top) as a relative change in fluorescence. Letters along the graph represent the time at which the figures shown below have been taken. B, false colour images obtained with a Bio-Rad MRC600 confocal microscope, where blue represents low level of Ca2+ and red high level. One can see the Z bands (regular striations on the muscle surface) as well as the elongated structure of the NMJ that extends along the main axis of the muscle fibre. The region of interest (ROI) illustrated in image 1 depicts the area that was used to measure the changes in pixel intensity over the PSC soma.
Figure 2
Figure 2
Effects of treatments on short-term synaptic plasticity: high frequency facilitation, depression and PTP A and B, mean EPP amplitude before, during and after high frequency stimulation (40 Hz, 30 s). A, sham (black, open circles, N= 6 frogs; sham: n= 9 NMJs) and α-BTx-treated NMJs (grey, open circles, N= 6 frogs, n= 8 NMJs). B, control (black, filled circles, N= 7 frogs, control: n= 7 NMJs) and stimulated NMJs (grey, filled circles, N= 10 frogs, n= 10 NMJs). Mean amplitude is normalized to the mean EPP amplitude during the initial 0.2 Hz control period. Inset: enlarged view of the 40 Hz, 30 s stimulation period. C, bar graph depicting changes in short-term synaptic plasticity for α-BTx-treated (white) and stimulated NMJs (grey) relative to sham and control NMJs (100%, dotted line), respectively. Asterisks show statistically significant changes in EPP amplitude from EPP amplitude at rest (i.e. prior to high frequency stimulation). On average, α-BTx-treated NMJs presented weaker facilitation at the beginning of the stimulation train, more pronounced depression at the end and smaller PTP that did not last as long as sham NMJs. Stimulated NMJs presented greater facilitation at the beginning of the stimulation train and less depression at the end while PTP remained unchanged compared to control.
Figure 3
Figure 3
Effects of treatments on nerve evoked PSC calcium responses A and B, characteristic calcium responses evoked by 40 Hz, 30 s stimulation in PSCs. A, α-BTx-treated (grey, open circles) and sham NMJs (black, open circles). B, chronically stimulated (grey, filled circles) and control NMJs (black, filled circles). C and D, mean calcium responses evoked by 40 Hz, 30 s stimulation in PSCs. C, α-BTx-treated (grey, open circles, n= 24 PSCs, N= 8 frogs) and sham NMJs (black, open circles, n= 18 PSCs, N= 8 frogs). D, stimulated (grey, filled circles, n= 40 PSCs, N= 19 frogs) and control NMJs (black, filled circles, n= 37 PSCs, N= 19 frogs). Variability for control and treated NMJs is represented as dark grey and light grey filled regions surrounding the mean. E and F, bar graphs depicting changes in nerve-evoked PSC calcium responses of α-BTx-treated (white) and stimulated NMJs (grey) relative to sham and control NMJs (100%, dotted line), respectively. Asterisks show statistically significant changes. Only α-BTx-treated NMJs show altered nerve-evoked PSC calcium responses, in terms of amplitude, half-width, area under the curve, delay and rise slope, compared to sham.
Figure 4
Figure 4
Model of transmitter release during 40 Hz, 30 s stimulation A, mean PSC calcium response (upper trace) and estimated amount of transmitter released by α-BTx-treated NMJs (grey open circles), relative to sham NMJs (black, open circles). B, enlarged view of A showing the first 20 s of stimulation. Note the delay of PSC calcium response onset in α-BTx-treated NMJs, despite putative larger amount of transmitter released. C, mean PSC calcium response (upper trace) and estimated amount of transmitter released by stimulated NMJs (grey, filled circles) relative to control NMJs (black, filled circles) during the time course of PSC calcium responses. D, enlarged view of C showing the first 20 s of stimulation. Note the similarities between PSC calcium responses in stimulated and control NMJs, despite putative smaller amount of transmitter released in stimulated NMJs.
Figure 5
Figure 5
Effects of treatments on PSC calcium responses evoked with maximal effective ATP concentration A and B, characteristic PSC calcium responses evoked with maximal effective ATP concentration (giving 100% cell responsiveness). A, α-BTx-treated (grey, open circles) and sham NMJs (black, open circles). B, chronically stimulated (grey, filled circles) and control NMJs (black, filled circles). C and D, mean calcium responses evoked with maximal effective ATP concentration. C, α-BTx-treated (grey, open circles, n= 36 PSCs, N= 4 frogs) and sham NMJs (black, open circles, n= 31 PSCs, N= 3 frogs) D, chronically stimulated (grey, filled circles, n= 13 PSCs, N= 5 frogs) and control NMJs (black, filled circles, n= 17 PSCs, N= 5 frogs). Variability for control and treated NMJs is represented as dark grey and light grey filled regions surrounding the mean. E and F, bar graphs depicting changes in ATP evoked PSC calcium responses of α-BTx-treated (white) and stimulated NMJs (grey) relative to sham and control NMJs (100%, dotted line), respectively. Asterisks show statistically significant changes. Only α-BTx-treated NMJs show altered PSC calcium responses, in terms of duration, compared to sham at this maximal effective concentration.
Figure 6
Figure 6
Effects of chronic nerve stimulation on PSC calcium responses evoked with submaximal effective ATP concentration A, frequency bar graph depicting the distribution of PSC sensitivity to submaximal effective ATP concentration (allowing sensitivity categorization) in chronically stimulated (grey) and control (black) NMJs. The proportion of highly sensitive PSCs is increased in stimulated NMJs, likely at the expense of moderately sensitive cells. B, characteristic calcium responses evoked with submaximal effective ATP concentration in low sensitive PSCs of stimulated (grey, filled circles) and control NMJs (black, filled circles). C, mean calcium response evoked with submaximal effective ATP concentration in low sensitive PSC of stimulated (grey, filled circles, n= 64 PSCs, N= 13 frogs) and control NMJs (black, filled circles, n= 58 PSCs, N= 13 frogs). Variability for control and stimulated NMJs is represented as dark grey and light grey filled regions surrounding the mean. D and E, bar graphs depicting changes in ATP evoked PSC calcium responses of stimulated NMJs (grey) relative to control NMJs (100%, dotted line). Asterisks show statistically significant changes. PSC calcium responses evoked with submaximal effective concentration of ATP are altered by chronic nerve stimulation, in terms of duration, half-width and area under the curve.
Figure 7
Figure 7
Effect of treatments on muscarine-evoked PSC calcium responses A and B, bar graph depicting the distribution of PSC sensitivity to submaximal effective muscarine concentration (allowing sensitivity categorization). A, in α-BTx-treated (light grey) and sham NMJs (white). B, chronically stimulated (grey) and control NMJs (black). The distribution of PSCs in the different sensitivity groups is only altered for stimulated NMJs. The proportion of weakly sensitive PSCs is increased in chronically stimulated NMJs, which is likely to be at the expense of highly sensitive cells. C and D, characteristic calcium responses evoked with submaximal effective muscarine concentration. C, weakly sensitive PSCs of α-BTx-treated (grey, open circles) and sham NMJs (black, open circles). D, chronically stimulated (grey, filled circles) and control NMJs (black, filled circles). E and F, mean calcium responses evoked with submaximal effective concentration. E, weakly sensitive PSCs of α-BTx-treated (grey, open circles, n= 37 PSCs, N= 8 frogs) and shams NMJs (black, open circles, n= 36, PSCs, N= 6 frogs). F, chronically stimulated (grey, filled circles, n= 36 PSCs, N= 15 frogs) and control NMJs (black, filled circles, n= 45 PSCs, N= 15 frogs). Variability for control and treated NMJs is represented as dark grey and light grey filled regions surrounding the mean. G and H, bar graphs depicting changes in calcium responses evoked by muscarine in weakly sensitive PSCs of α-BTx-treated (white) and stimulated NMJs (grey) relative to sham and control NMJs (100%, dotted line), respectively. Asterisks show statistically significant changes. Only α-BTx-treated NMJs show altered PSC calcium responses compared to sham at this submaximal effective concentration, in terms of amplitude, duration, half-width, area under the curve, rise slope and decay time.

Similar articles

Cited by

References

    1. Auld DS, Robitaille R. Glial cells and neurotransmission: an inclusive view of synaptic function. Neuron. 2003;40:389–400. - PubMed
    1. Belair EL, Vallee J, Robitaille R. Long-term in vivo modulation of synaptic efficacy at the neuromuscular junction of Rana pipiens frogs. J Physiol. 2005;569:163–178. - PMC - PubMed
    1. Bourque MJ, Robitaille R. Endogenous peptidergic modulation of perisynaptic Schwann cells at the frog neuromuscular junction. J Physiol. 1998;512:197–209. - PMC - PubMed
    1. Castonguay A, Robitaille R. Differential regulation of transmitter release by presynaptic and glial Ca2+ internal stores at the neuromuscular synapse. J Neurosci. 2001;21:1911–1922. - PMC - PubMed
    1. Constable AL, Armati PJ, Toyka KV, Hartung HP. Production of prostanoids by Lewis rat Schwann cells in vitro. Brain Res. 1994;635:75–80. - PubMed

Publication types

MeSH terms

LinkOut - more resources