. 2010 Feb 8;188(3):335-49.
doi: 10.1083/jcb.200904040.

SOLO: a meiotic protein required for centromere cohesion, coorientation, and SMC1 localization in Drosophila melanogaster

Affiliations

SOLO: a meiotic protein required for centromere cohesion, coorientation, and SMC1 localization in Drosophila melanogaster

Rihui Yan et al. J Cell Biol. .

Abstract

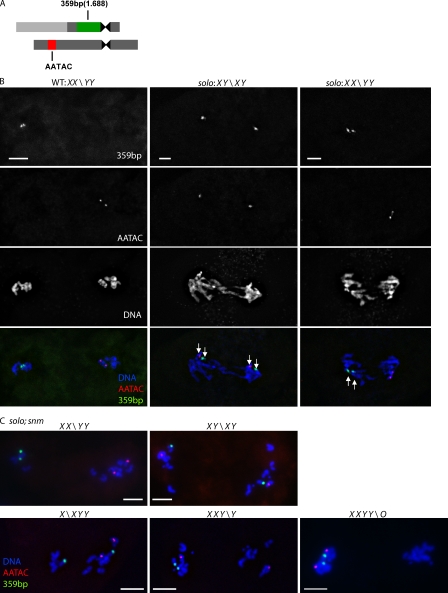
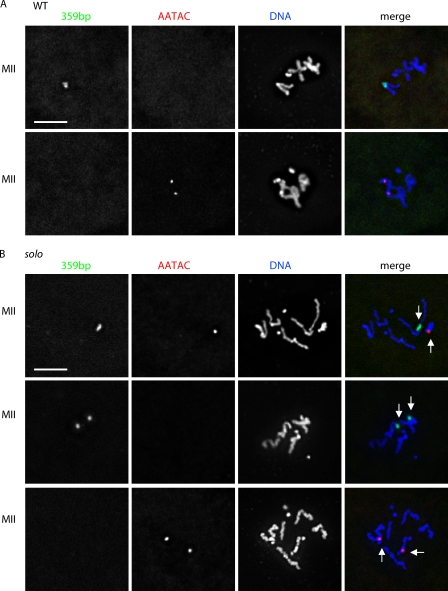
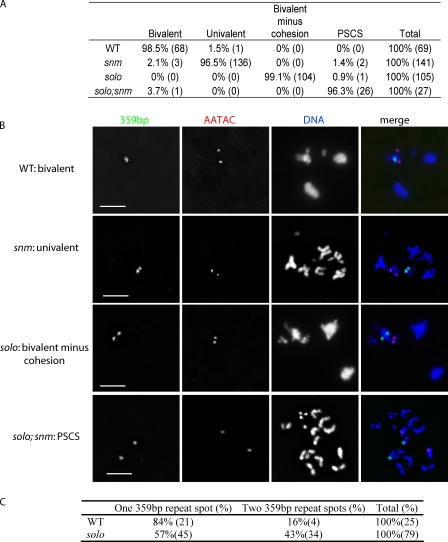
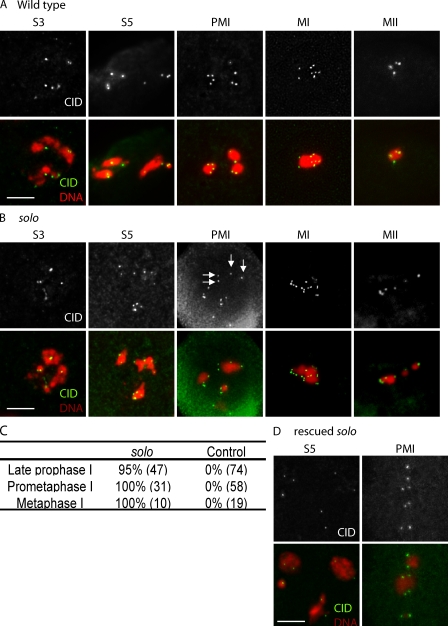
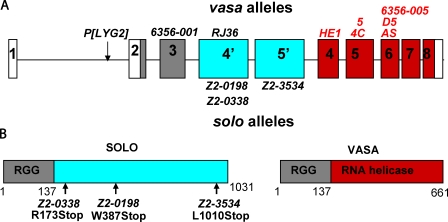
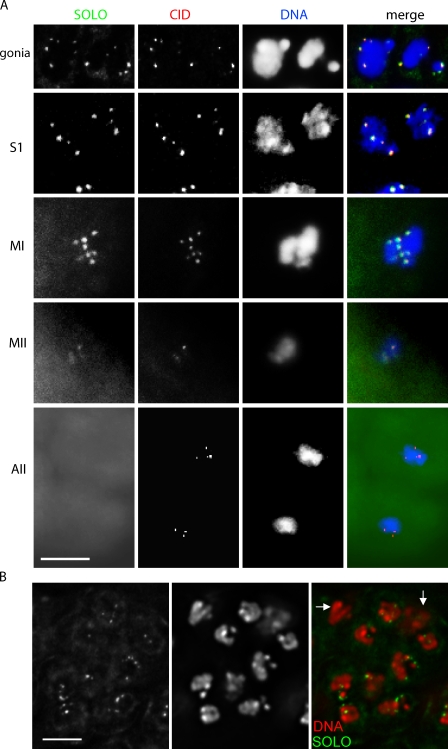
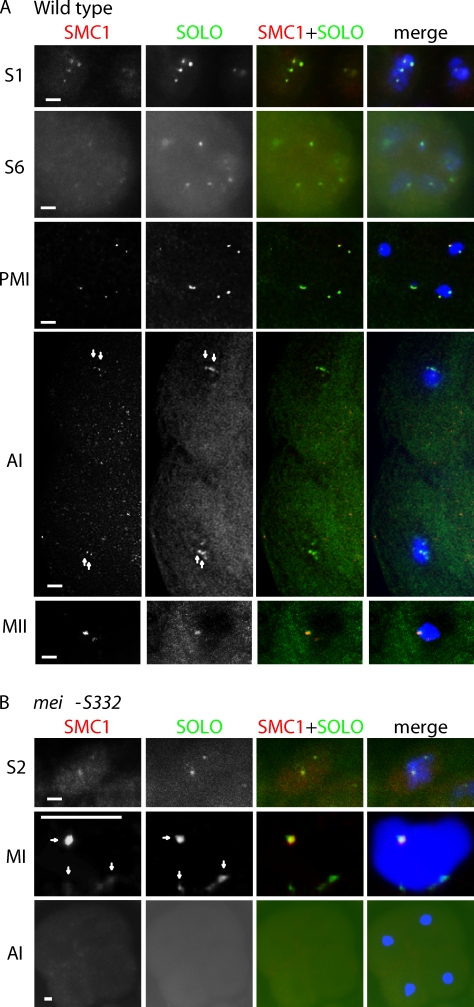
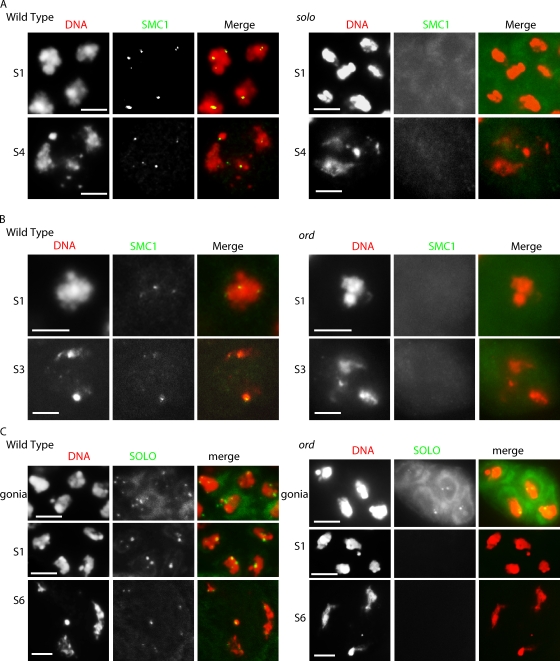
Sister chromatid cohesion is essential to maintain stable connections between homologues and sister chromatids during meiosis and to establish correct centromere orientation patterns on the meiosis I and II spindles. However, the meiotic cohesion apparatus in Drosophila melanogaster remains largely uncharacterized. We describe a novel protein, sisters on the loose (SOLO), which is essential for meiotic cohesion in Drosophila. In solo mutants, sister centromeres separate before prometaphase I, disrupting meiosis I centromere orientation and causing nondisjunction of both homologous and sister chromatids. Centromeric foci of the cohesin protein SMC1 are absent in solo mutants at all meiotic stages. SOLO and SMC1 colocalize to meiotic centromeres from early prophase I until anaphase II in wild-type males, but both proteins disappear prematurely at anaphase I in mutants for mei-S332, which encodes the Drosophila homologue of the cohesin protector protein shugoshin. The solo mutant phenotypes and the localization patterns of SOLO and SMC1 indicate that they function together to maintain sister chromatid cohesion in Drosophila meiosis.


Figures

Figure 1.
Figure 1.
X-Y segregation patterns at anaphase I in solo and solo; snm males. X and Y chromatids were recognized by probes against 359 bp (green) and AATAC (red) satellite DNA repeats, respectively. DNA was stained with DAPI. Sum projections of 3D-deconvolved z series stacks were performed. (A) Schematic representation of probes on sex chromosomes used in FISH analysis. The 359 bp repeat probe detects a large heterochromatic region proximal to the X centromere; the AATAC repeat probe hybridizes to the middle of the long arm of the Y chromosome. (B) Representative segregation patterns in WT and soloZ2-0198/Df(2L)A267 spermatocytes. (left) Reductional segregation of X and Y chromatids in WT spermatocytes as indicated by 359 bp and AATAC probe signals at opposite poles. (middle and right) Equational and reductional (respectively) segregation of X and Y chromatids in solo spermatocytes. White arrows indicate fully separate sister chromatid probe signals. (C) Representative segregation patterns in solo; snm (soloZ2-0198/soloZ2-3534; snmZ3-2138/snmZ3-0317) spermatocytes. Merged images only are shown. Bars, 5 µm.
Figure 2.
Figure 2.
PSCS in solo metaphase II spermatocytes. X and Y chromosomes were recognized by probes against 359 bp (green) and AATAC (red) satellite DNA repeats, respectively. DNA was stained with DAPI. Sum projections of 3D-deconvolved z series stacks were performed. (A) WT metaphase II (MII) nuclei all result from reductional meiosis I segregation and exhibit intact sister centromere cohesion. 128 spermatocytes were observed: 66 with either one bright 359 bp spot or two closely adjacent 359 bp spots and no AATAC spots (top), 61 with two AATAC spots and no 359 spots (bottom), and one with two well-separated 359 spots and no AATAC spots. (B) solo metaphase II nuclei exhibit PSCS and result from a mix of equational and reductional meiosis I segregation. Spermatocytes from adult soloZ2-0198/Df(2L)A267 were examined. 359 bp and AATAC signals are indicated by white arrows. (top) Nucleus with one 359 bp spot and one AATAC spot reflecting equational meiosis I segregation. (middle and bottom) Nuclei with two spots of 359 bp and no AATAC repeats or two spots of AATAC repeats and no 359 bp repeats, respectively, reflecting reductional meiosis I segregation. Bars, 5 µm.
Figure 3.
Figure 3.
Sister chromatid cohesion and homologue pairing at prometaphase I in solo; +, +; snm, and solo; snm mutants. X and Y chromosomes were recognized by probes against the 359 bp (green) and AATAC (red) satellite DNA repeats, respectively. DNA was stained with DAPI. Sum projections of 3D-deconvolved z series stacks were performed. (A) Quantification of cohesion and pairing patterns. Table shows the percent and number of nuclei (in parentheses) exhibiting indicated pairing and cohesion patterns. (B) Representative images. Bivalents versus univalents were judged from DAPI panels. Presence or absence of cohesion was based on separation between sister chromatids as judged from DAPI images and on separation between sister FISH signals. Bars, 5 µm. (C) Quantification of 359 bp signal separation patterns. See Table II for genotypes.
Figure 4.
Figure 4.
Cohesion of sister centromeres is lost by late prophase I in solo mutants. (A, B, and D) Testes from WT (A), solo/Df(2L)A267 (B), and rescued solo (solo/Df(2L)A267; {UASp-Venus::SOLO}/{nos-GAL4::VP16}) (D) males stained with anti-CID antibody to identify centromeres and with DAPI to visualize DNA. Sum or maximum projections of 3D-deconvolved z series stacks were performed to obtain CID signals. No more than eight CID spots are present in WT meiosis I at any stage, whereas solo spermatocytes show more than eight CID spots at late prophase I, prometaphase I, and metaphase I (11, 13, and 15 spots, respectively, in the nuclei shown). Arrows indicate a bivalent with four fully separated sister centromeres. S3, mid–prophase I; S5, late prophase I; PMI, prometaphase I; MI, metaphase I; MII, metaphase II. Bars, 5 µm. (C) Quantification of CID spots in (soloZ2-0198/Df(2L)A267) at different stages. The percent of spermatocytes with more than eight spots is shown. The number of nuclei scored is in parentheses.
Figure 5.
Figure 5.
Molecular characterization of solo. (A) The genomic structure of solo and vas. The solo and vas transcription units share exons 1–3. Gray shading represents shared translated sequences, and white represents the 5′ and 3′ untranslated region. Exons 4’ and 5′ (blue) are unique to solo, and exons 4–8 (red) are unique to vas. Mutations above the locus are vas alleles, those in red fully complement solo, and those in black fail to complement solo. solo mutations are shown below the locus. (B) Predicted structures of SOLO and VASA proteins and mutation sites of solo alleles.
Figure 6.
Figure 6.
Localization pattern of SOLO. (A) Colocalization of Venus::SOLO and CID on meiotic centromeres in WT spermatocytes. {UASp-Venus::SOLO}/{nos-GAL4::VP16}) WT males were stained with anti-CID and DAPI. (B) SOLO::Venus localizes to spermatogonia (gonia) but not somatic cyst cells in an eight-cell cyst from UPS-SOLO:Venus males. Arrows indicate cyst nuclei. Venus::SOLO and SOLO::Venus were detected by native fluorescence. S1, early prophase I; MI, metaphase I; MII, metaphase II; AII, anaphase II. Bars, 5 µm.
Figure 7.
Figure 7.
Colocalization of Venus::SOLO and SMC1 foci on centromeres in WT and mei-S332 spermatocytes. Venus::SOLO and SMC1 foci were detected by anti-GFP and anti-SMC1, respectively, and DNA was stained with DAPI. (A and B) Venus::SOLO and SMC1 foci colocalize until anaphase II in WT (A) but are lost by anaphase I in mei-S332 (B). Arrows point to colocalizing foci. Mutant spermatocytes are from mei-S3324/mei-S3328; {UASp-Venus::SOLO}/{nos-GAL4::VP16} males. All images are sum projections of 3D-deconvolved z series planes. S1 and S2, early prophase I; S6, late prophase I; PMI, prometaphase I; AI, anaphase I; MI, metaphase I; MII, metaphase II. Bars, 1 µm.
Figure 8.
Figure 8.
Interactions among SOLO, ORD, and SMC1. (A and B) Absence of SMC1 foci in solo (A) and ord (B) mutants. SMC1 foci were detected by anti-SMC1, and DNA was stained with DAPI. Mutant spermatocytes are from soloZ2-0198/soloZ2-0198 (A) and ord5/Df(2R)WI370 (B) adult males. Centromeric SMC1 foci are visible throughout prophase I in WT but are completely absent in solo and ord spermatocytes. (C) Effect of ord hemizygosity on Venus::SOLO localization. Venus::SOLO was detected by native fluorescence (FITC channel), and DNA was stained with DAPI using spermatocytes from ord5/Df(2R)WI370; {UASp-Venus::SOLO}/{nos-GAL4::VP16} adult males. Venus::SOLO foci are robust in spermatogonia (gonia) but absent in early and late prophase I meiotic stages in ord mutants. All images are sum projections of 3D-deconvolved z series planes. S1, early prophase I; S3 and S4, mid–prophase I; S6, late prophase I. Bars, 5 µm.

Similar articles

Cited by

References

    1. Ahmad K., Henikoff S. 2001. Centromeres are specialized replication domains in heterochromatin. J. Cell Biol. 153:101–110 10.1083/jcb.153.1.101 - DOI - PMC - PubMed
    1. Alex D., Lee K.A. 2005. RGG-boxes of the EWS oncoprotein repress a range of transcriptional activation domains. Nucleic Acids Res. 33:1323–1331 10.1093/nar/gki270 - DOI - PMC - PubMed
    1. Ashburner M., Thompson P., Roote J., Lasko P.F., Grau Y., el Messal M., Roth S., Simpson P. 1990. The genetics of a small autosomal region of Drosophila melanogaster containing the structural gene for alcohol dehydrogenase. VII. Characterization of the region around the snail and cactus loci. Genetics. 126:679–694 - PMC - PubMed
    1. Balicky E.M., Endres M.W., Lai C., Bickel S.E. 2002. Meiotic cohesion requires accumulation of ORD on chromosomes before condensation. Mol. Biol. Cell. 13:3890–3900 10.1091/mbc.E02-06-0332 - DOI - PMC - PubMed
    1. Bickel S.E., Wyman D.W., Miyazaki W.Y., Moore D.P., Orr-Weaver T.L. 1996. Identification of ORD, a Drosophila protein essential for sister chromatid cohesion. EMBO J. 15:1451–1459 - PMC - PubMed

Publication types

MeSH terms

Substances