. 2010 Feb 8;188(3):415-28.
doi: 10.1083/jcb.200908010.

Localized topological changes of the plasma membrane upon exocytosis visualized by polarized TIRFM

Affiliations

Localized topological changes of the plasma membrane upon exocytosis visualized by polarized TIRFM

Arun Anantharam et al. J Cell Biol. .

Abstract

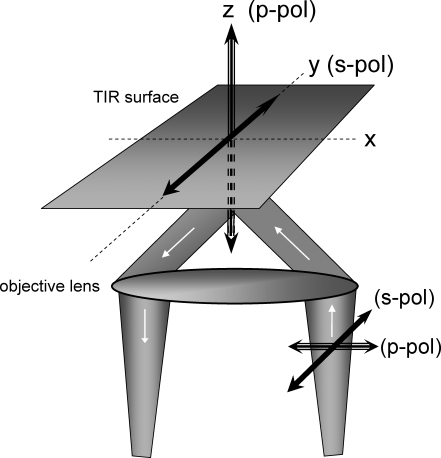
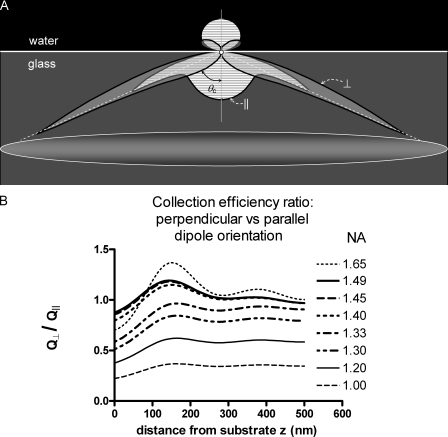
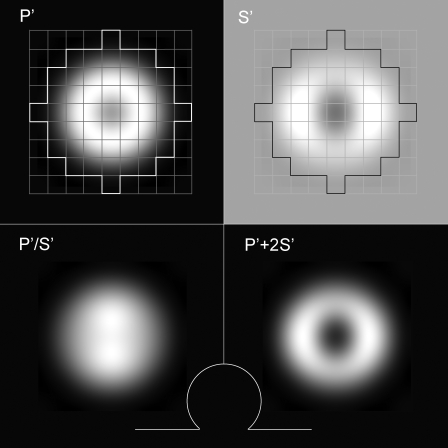
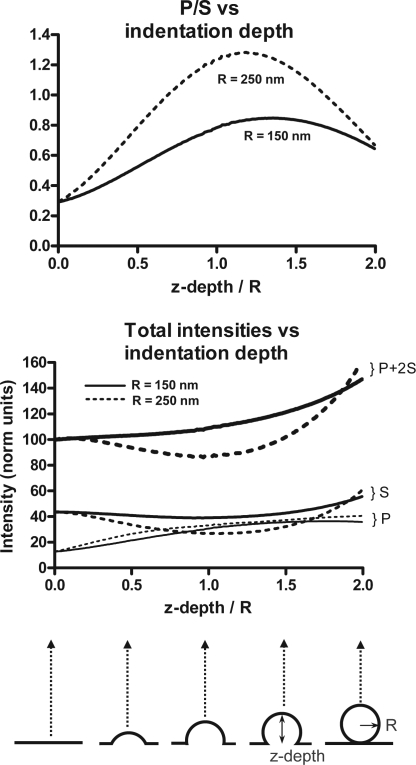
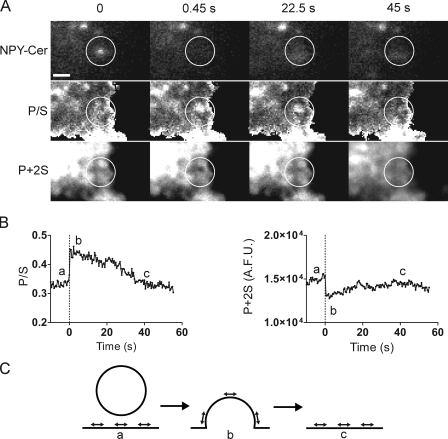
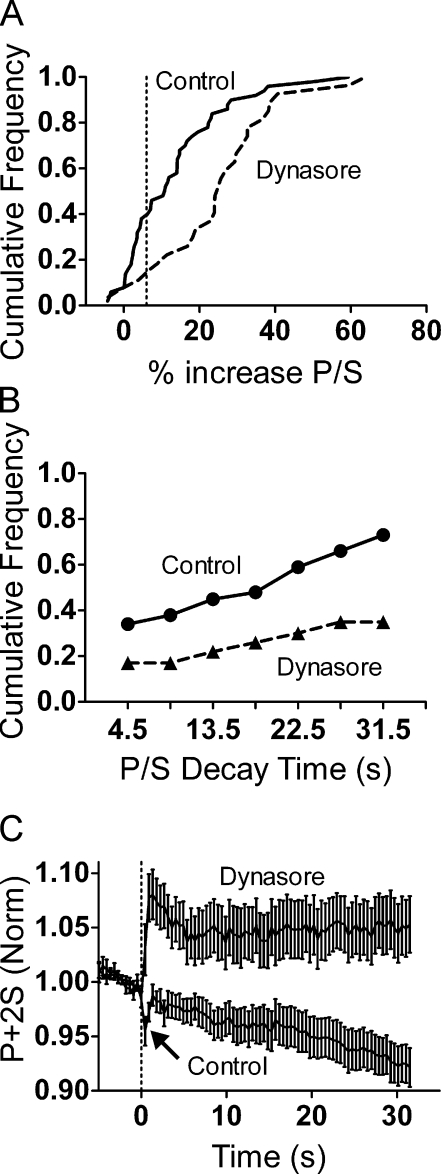
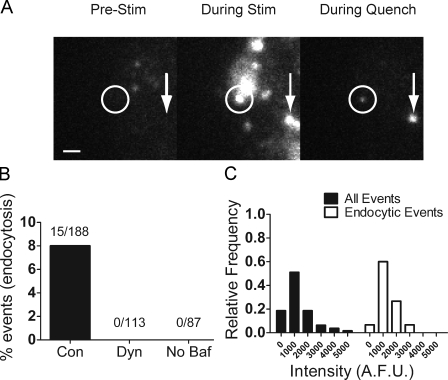
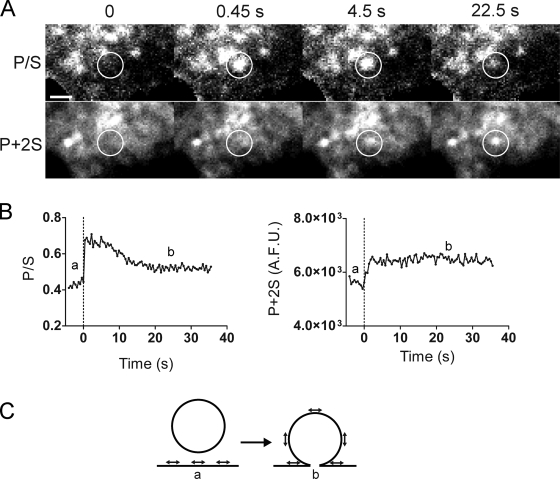
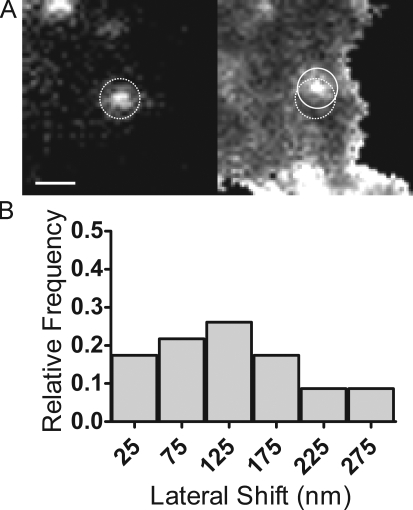
Total internal reflection fluorescence microscopy (TIRFM) images the plasma membrane-cytosol interface and has allowed insights into the behavior of individual secretory granules before and during exocytosis. Much less is known about the dynamics of the other partner in exocytosis, the plasma membrane. In this study, we report the implementation of a TIRFM-based polarization technique to detect rapid submicrometer changes in plasma membrane topology as a result of exocytosis. A theoretical analysis of the technique is presented together with image simulations of predicted topologies of the postfusion granule membrane-plasma membrane complex. Experiments on diI-stained bovine adrenal chromaffin cells using polarized TIRFM demonstrate rapid and varied submicrometer changes in plasma membrane topology at sites of exocytosis that occur immediately upon fusion. We provide direct evidence for a persistent curvature in the exocytotic region that is altered by inhibition of dynamin guanosine triphosphatase activity and is temporally distinct from endocytosis measured by VMAT2-pHluorin.


Figures

Figure 1.
Figure 1.
Coordinate system. The plane of incidence (which contains both the incident and reflected beams) is the x-z plane. The incident propagating beam (traveling up along z) is transversely polarized in either the x or y directions, which correspond to p-pol and s-pol, respectively. The evanescent field is polarized either primarily in the z direction (for p-pol) or entirely in the y direction (for s-pol).
Figure 2.
Figure 2.
Emissions from polarized excitations and the numerical aperture. (A) Emission pattern from a fluorophore dipole located in water at z = 0 nm distance from a glass substrate. The fluorophore is shown as a small circle. The pattern is derived from the equations in Hellen and Axelrod (1987). The intensity into any polar angle is depicted as the radial distance from the dipole to the end of the shaded pattern; the gray horizontal stripe pattern and the uniform gray pattern indicates the emission from a dipole parallel and perpendicular to the surface, respectively. See Results for explanation. (B) Effect of objective NA on the collection efficiency for perpendicular and parallel dipole orientation. The relative amount of light captured from dipoles oriented parallel versus perpendicular to the substrate depends strongly on the objective NA and on distance z. These dependencies are shown in graphs of Q/Q versus z for several different popular NAs. Objective-based TIR illumination requires an NA of at least 1.45; it is those objectives that show Q/Q close to unity, with some undulations as a function of z. The 1.49 NA shows the smallest deviation from unity over the whole range of z distances and allows the conclusion that P+2S is a fairly good measure of total concentration. The 1.65 NA must use refractive index 1.78 (rather than 1.52) coverslip and oil, so the distortion of the emission pattern (as a result of near-field capture) is the strongest for that objective.
Figure 3.
Figure 3.
Simulated Images. Based on Eq. 6 and a custom IDL program, the expected intensity patterns P’ and S’ for p-pol and s-pol excitation, respectively, are shown for a diI-labeled spherical granule fusing with (and truncated by) a diI-labeled planar plasma membrane. In this particular simulation, most of the sphere is still intact; only the lower one fourth of its radius is truncated off. The schematic line drawing (white) shows a side view of this configuration at the same scale as the simulated images. The effects of finite evanescent depth, optical resolution limit, and nonparallelism of the diI dipole with the membrane are all included in generating these P’ and S’ patterns, thereby simulating what appears at the CCD array image plane. The pixelation of the CCD array is superimposed along with an outline showing which pixels are actually used to integrate the total intensities P and S. The ratio P’/S’ and the sum P’+2S’ are also shown. The corresponding pixel by pixel ratios and sums on experimental data (as pixelated by the camera) are used to determine lateral positions of diI/membrane morphology features at the time of exocytosis. However, extended temporal tracking of the p-pol and s-pol ratios and sums uses the spatially integrated values P and S (without the primes) before forming the P/S and P+2S combinations. The predictions of the simulations are sensitive to the assumed parameters, which are set close to the actual or expected experimental values: granule radius = 150 nm; Airy disk half-width (out to first minimum) = 211 nm; evanescent field depth = 110 nm; side length of CCD array pixel (as projected onto the image) = 73 nm; angle β between membrane normal and diI dipole = 69°. The P’ and S’ images are shown with the same grayscale; the P’/S’ and P’+2S’ each have their own gray scales.
Figure 4.
Figure 4.
Simulated P/S and P+2S as a function of spherical indentation depth zd. The geometry of the indentation structure is schematically shown at the bottom. The individual P and S intensities are also shown. The exact Q versus z and Q versus z collection efficiencies, as calculated from Hellen and Axelrod (1987) for NA = 1.49, were used to generate these curves. Parameters assumed in the simulation are R = 150 nm (solid) or 250 nm (dashed) radius spherical indentation, diI labeling in both the indentation and planar areas, convolution with a point-spread function of half-width 211 nm to simulate the optical resolution limit, an evanescent field e−1 depth of 110 nm, an angle β between diI dipoles and the normal to the plane of the membrane of 69° (see Test of theory…), and a distance between the TIR substrate and the planar parts of the structure of 50 nm. Images generated with these parameters are then pixelated in simulation with a pixel size of 73 nm. Only those pixels whose centers fall with a radius of 4-pixel widths (292 nm) from the center of the image are counted toward total intensities P and S. The values for P and S that would be expected from a completely flat membrane are seen as the ordinate intercepts at zd/R = 0. The curves are changed only slightly if the collection efficiencies Q and Q are equal at all z positions.
Figure 5.
Figure 5.
Changes in the topology of the plasma membrane at sites of exocytosis. (A) P/S and P+2S images were calculated and aligned to the NPY-Cer image at the times indicated. An NPY-Cer–labeled granule undergoes exocytosis between time 0 and 0.45 s. An increase in pixel intensity in the approximate location of the NPY-Cer image stack is observed, which is consistent with a change in orientation of membrane-intercalated diI (there is a 254-nm offset between the center of mass of the NPY-Cer granule and P/S spot; Fig. 9). In the P+2S image, a dimming is observed. Circles are centered over the last observed location of the granule. Bar, 1 µm. (B) Membrane P/S and P+2S were followed for almost 60 s. The dotted line at time 0 indicates the frame before fusion (i.e., the last frame in which the NPY-Cer granule was clearly visible). (C) One possible interpretation of the results in A and B are considered. DiI transition dipole moment orientation is indicated by direction of arrows.
Figure 6.
Figure 6.
The magnitude and duration of P/S and P+2S changes at the sites of fusion differ in control and dynasore-treated cells. (A) A cumulative frequency histogram was generated to compare the frequency and magnitude of P/S changes observed with fusion in control (50 granules) and dynasore (27 granules)-treated cells. A greater fraction of fusion events show an associated increase in P/S with dynasore. The percent increase was calculated by taking the difference between the P/S at a particular frame (P/S)f and the mean P/S of 10 prefusion frames (Avepre) divided by the mean; [(P/S)f − Avepre]/Avepre. The two histograms are significantly different (P < 0.05 by Mann-Whitney test). (B) The decay of the initial increase in P/S after granule fusion was followed. Only those events that showed an increase of at least 6% in P/S (compared with the prefusion baseline) in the first 0.45 s after fusion and that could be followed for 31.5 s after fusion were considered (control, n = 29; dynasore, n = 25). The fraction of events with a P/S increase that subsequently declines to the baseline within 4.5, 9, 13.5, 18, 22.5, 27, and 31.5 s are plotted for the two conditions. (C) The P+2S of fusion events with a significant increase in P/S were aligned to their prefusion frames and averaged (control, n = 29; dynasore, n = 25). The data were also normalized to the mean of 10 prefusion frames. The arrow indicates a transient dip in P+2S in control cells. In dynasore-treated cells, an increase in P+2S is usually observed. The two datasets are significantly different at every point after time 0 (P < 0.05 by Student’s unpaired t test). Numbers are presented ± SEM.
Figure 7.
Figure 7.
Endocytosis at the site of fusion is infrequently observed. Chromaffin cells expressing VMAT-2 pHluorin were exposed to cycles of low, pH 5.5, and high, pH 7.4, every 10 s after an initial 15-s stimulation with 56 mM K+ in the presence of bafilomycin. (A) Two bright puncta (fusion events) that appear during stimulation are highlighted (circle and arrow). These events are subsequently insensitive to low pH exposure (quench) within 25 (circle) and 10 s (arrow). Bar, 1 µm. (B) Low pH-insensitive events (endocytic events) expressed as a percentage of total fusion events observed. (C) The initial intensity of all fusion events compared with the intensity of only the events that subsequently showed rapid endocytosis.
Figure 8.
Figure 8.
Plasma membrane topological changes become long lived in the presence of dynasore. Dynasore was added to the bathing solution at a final concentration of 80 µM at least 10 min before the imaging. (A) Long-lived increases in P/S and P+2S are observed after fusion of a granule (release of NPY-Cer). Circles are centered over the last observed location of the granule. Bar, 1 µm. (B) Data from A is presented with the vertical dotted line indicating the frame before fusion. (C) Schematic interpretation of the event in A. In the presence of dynasore, a fused structure is formed with significant indentation and curvature that is connected to the plasma membrane.
Figure 9.
Figure 9.
Lateral displacement of localized topological change in plasma membrane and the last granule position before fusion. (A, left) A dashed circle is centered on the last observed position of a fusing granule. (right) A solid circle is centered on the first observed location of a P/S spot. Bar, 800 nm. (B) The lateral displacement from the center of mass of the fusing granule to the center of mass of the P/S puncta for 23 fusion events is plotted in a frequency histogram. The mean displacement observed was 122 ± 15 nm.

Similar articles

Cited by

References

    1. Allersma M.W., Wang L., Axelrod D., Holz R.W. 2004. Visualization of regulated exocytosis with a granule-membrane probe using total internal reflection microscopy. Mol. Biol. Cell. 15:4658–4668 10.1091/mbc.E04-02-0149 - DOI - PMC - PubMed
    1. Allersma M.W., Bittner M.A., Axelrod D., Holz R.W. 2006. Motion matters: secretory granule motion adjacent to the plasma membrane and exocytosis. Mol. Biol. Cell. 17:2424–2438 10.1091/mbc.E05-10-0938 - DOI - PMC - PubMed
    1. Artalejo C.R., Elhamdani A., Palfrey H.C. 2002. Sustained stimulation shifts the mechanism of endocytosis from dynamin-1-dependent rapid endocytosis to clathrin- and dynamin-2-mediated slow endocytosis in chromaffin cells. Proc. Natl. Acad. Sci. USA. 99:6358–6363 10.1073/pnas.082658499 - DOI - PMC - PubMed
    1. Axelrod D. 1979. Carbocyanine dye orientation in red cell membrane studied by microscopic fluorescence polarization. Biophys. J. 26:557–573 10.1016/S0006-3495(79)85271-6 - DOI - PMC - PubMed
    1. Axelrod D. 2001. Total internal reflection fluorescence microscopy in cell biology. Traffic. 2:764–774 10.1034/j.1600-0854.2001.21104.x - DOI - PubMed

Publication types