

Impact of initial pathogen density on resistance and tolerance in a polymorphic disease resistance gene system in Arabidopsis thaliana
- PMID: 20142437
- PMCID: PMC2870963
- DOI: 10.1534/genetics.109.112383
Impact of initial pathogen density on resistance and tolerance in a polymorphic disease resistance gene system in Arabidopsis thaliana
Abstract
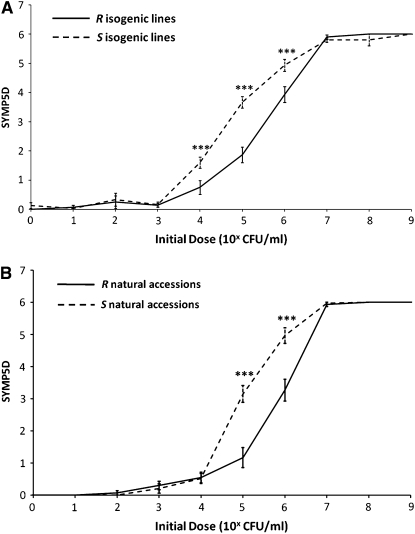
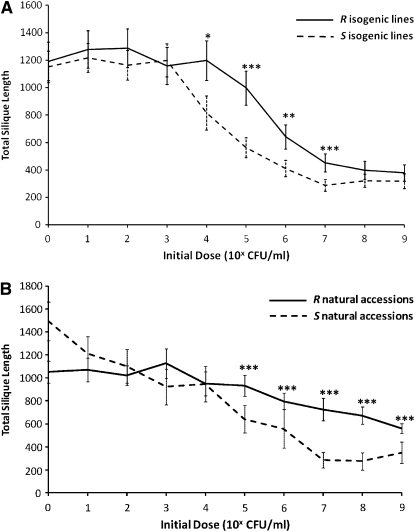
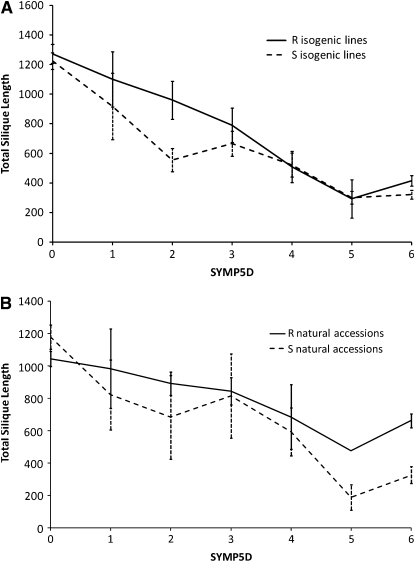
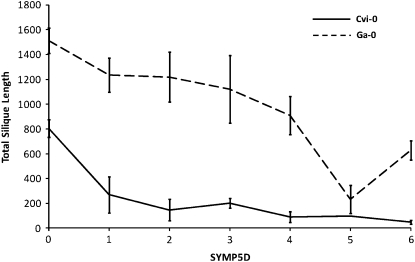
The evolution of natural enemy defense shapes evolutionary trajectories of natural populations. Although the intensity of selection imposed by enemies clearly varies among natural populations, little is known about the reaction norm of genotypes under a gradient of selective pressure. In this study, we measure the quantitative responses of disease symptoms and plant fitness to a gradient of infection, focusing on the gene-for-gene interaction between the Rpm1 resistance gene in Arabidopsis thaliana and the AvrRpm1 avirulence gene in the bacterial pathogen Pseudomonas syringae. Two complementary sets of plant material were used: resistant (R) and susceptible (S) isogenic lines and a set of six natural accessions, three of which are Rpm1 resistant (R) and three of which are rpm1 susceptible (S). Nine initial pathogen densities were applied to each plant line. Using isogenic lines allows any differences between R and S lines to be attributed directly to the Rpm1 gene, whereas using natural accessions allows the natural variation of resistance and tolerance over a gradient of infection dosages within R and S accessions to be described. For both sets of plant material, increased infection dosage results in more extensive disease symptoms, with a subsequent decrease in seed production. The severity of disease symptoms was reduced in R relative to S subgroups, and the presence of the Rpm1 allele led to an increase in plant fitness. Tolerance, defined as the ability to sustain infection without a reduction in fitness, was directly affected by Rpm1, providing a novel demonstration of an R gene affecting tolerance. Genetic variation for tolerance was also found within the S and R natural accessions, suggesting the potential for selection to act upon this important trait.
Figures
Similar articles
-
Arabidopsis TAO1 is a TIR-NB-LRR protein that contributes to disease resistance induced by the Pseudomonas syringae effector AvrB.Proc Natl Acad Sci U S A. 2008 Apr 29;105(17):6475-80. doi: 10.1073/pnas.0802157105. Epub 2008 Apr 18. Proc Natl Acad Sci U S A. 2008. PMID: 18424557 Free PMC article.
-
Independent deletions of a pathogen-resistance gene in Brassica and Arabidopsis.Proc Natl Acad Sci U S A. 1998 Dec 22;95(26):15843-8. doi: 10.1073/pnas.95.26.15843. Proc Natl Acad Sci U S A. 1998. PMID: 9861058 Free PMC article.
-
Genetic variation for disease resistance and tolerance among Arabidopsis thaliana accessions.Proc Natl Acad Sci U S A. 2002 Aug 20;99(17):11270-4. doi: 10.1073/pnas.102288999. Epub 2002 Aug 9. Proc Natl Acad Sci U S A. 2002. PMID: 12172004 Free PMC article.
-
Plant defense: one post, multiple guards?!Mol Cell. 2003 Feb;11(2):284-6. doi: 10.1016/s1097-2765(03)00072-8. Mol Cell. 2003. PMID: 12620215 Review.
-
Putting knowledge of plant disease resistance genes to work.Curr Opin Plant Biol. 2001 Aug;4(4):281-7. doi: 10.1016/s1369-5266(00)00174-6. Curr Opin Plant Biol. 2001. PMID: 11418336 Review.
Cited by
-
Bayesian estimation and use of high-throughput remote sensing indices for quantitative genetic analyses of leaf growth.Theor Appl Genet. 2018 Feb;131(2):283-298. doi: 10.1007/s00122-017-3001-6. Epub 2017 Oct 20. Theor Appl Genet. 2018. PMID: 29058049
-
Recombination Rate Heterogeneity within Arabidopsis Disease Resistance Genes.PLoS Genet. 2016 Jul 14;12(7):e1006179. doi: 10.1371/journal.pgen.1006179. eCollection 2016 Jul. PLoS Genet. 2016. PMID: 27415776 Free PMC article.
-
Maladaptation in wild populations of the generalist plant pathogen Pseudomonas syringae.Evolution. 2011 Mar;65(3):818-30. doi: 10.1111/j.1558-5646.2010.01157.x. Epub 2010 Nov 5. Evolution. 2011. PMID: 21044058 Free PMC article.
-
A Genome-Wide Association study in Arabidopsis thaliana to decipher the adaptive genetics of quantitative disease resistance in a native heterogeneous environment.PLoS One. 2022 Oct 3;17(10):e0274561. doi: 10.1371/journal.pone.0274561. eCollection 2022. PLoS One. 2022. PMID: 36190949 Free PMC article.
-
Behavior of Olive Genotypes Against Quick Decline Syndrome (QDS) Caused by Xylella fastidiosa subsp. pauca in Apulia.Plants (Basel). 2025 Jan 8;14(2):157. doi: 10.3390/plants14020157. Plants (Basel). 2025. PMID: 39861511 Free PMC article.
References
-
- Barrett, L. G., J. M. Kniskern, N. Bodenhausen, W. Zhang and J. Bergelson, 2009. Continua of specificity and virulence in plant host-pathogen interactions: causes and consequences. New Phytol. 183 513–529. - PubMed
-
- Boots, M., and R. G. Bowers, 1999. Three mechanisms of host resistance to microparasites—avoidance, recovery and tolerance—show different evolutionary dynamics. J. Theor. Biol. 201 13–23. - PubMed
-
- Burdon, J. J., 1987. Diseases and Plant Population Biology. Cambridge University Press, Cambridge, MA.
-
- Carlsson-Granér, U., and P. H. Thrall, 2002. The spatial distribution of plant populations, disease dynamics and evolution of resistance. Oikos 97 97–110.
Publication types
MeSH terms
Grants and funding
LinkOut - more resources
Full Text Sources
Molecular Biology Databases
