Comparative Study
. 2010 Mar 2;107(9):4371-6.
doi: 10.1073/pnas.0911295107. Epub 2010 Feb 8.

Molecular complexity of successive bacterial epidemics deconvoluted by comparative pathogenomics

Affiliations
Comparative Study

Molecular complexity of successive bacterial epidemics deconvoluted by comparative pathogenomics

Stephen B Beres et al. Proc Natl Acad Sci U S A. .

Abstract

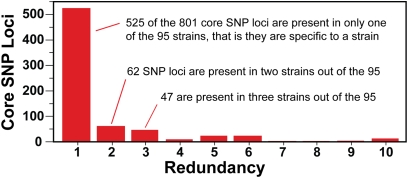
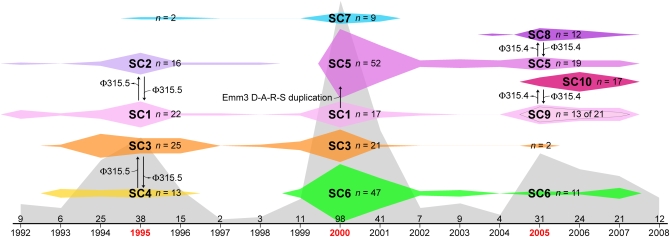
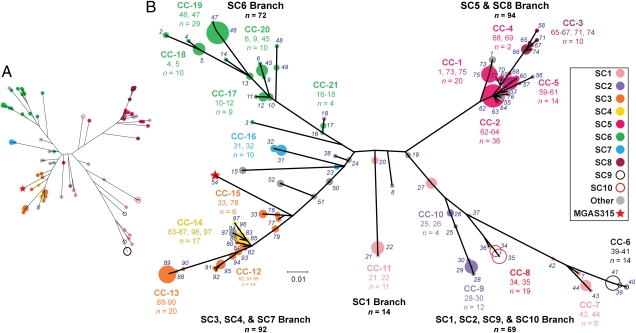
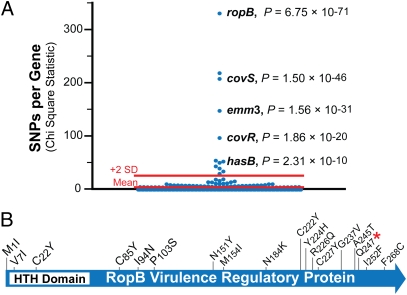
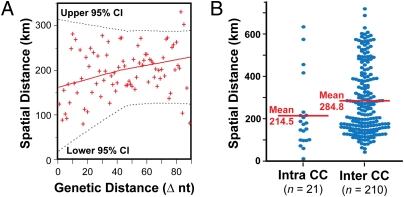
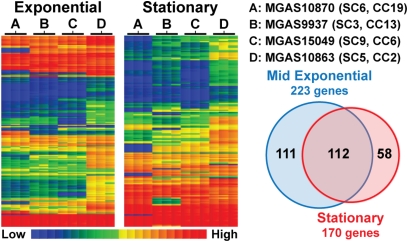
Understanding the fine-structure molecular architecture of bacterial epidemics has been a long-sought goal of infectious disease research. We used short-read-length DNA sequencing coupled with mass spectroscopy analysis of SNPs to study the molecular pathogenomics of three successive epidemics of invasive infections involving 344 serotype M3 group A Streptococcus in Ontario, Canada. Sequencing the genome of 95 strains from the three epidemics, coupled with analysis of 280 biallelic SNPs in all 344 strains, revealed an unexpectedly complex population structure composed of a dynamic mixture of distinct clonally related complexes. We discovered that each epidemic is dominated by micro- and macrobursts of multiple emergent clones, some with distinct strain genotype-patient phenotype relationships. On average, strains were differentiated from one another by only 49 SNPs and 11 insertion-deletion events (indels) in the core genome. Ten percent of SNPs are strain specific; that is, each strain has a unique genome sequence. We identified nonrandom temporal-spatial patterns of strain distribution within and between the epidemic peaks. The extensive full-genome data permitted us to identify genes with significantly increased rates of nonsynonymous (amino acid-altering) nucleotide polymorphisms, thereby providing clues about selective forces operative in the host. Comparative expression microarray analysis revealed that closely related strains differentiated by seemingly modest genetic changes can have significantly divergent transcriptomes. We conclude that enhanced understanding of bacterial epidemics requires a deep-sequencing, geographically centric, comparative pathogenomics strategy.


Conflict of interest statement

The authors declare no conflict of interest.

Figures

Fig. 1.
Fig. 1.
Distribution of SNPs among the sequenced serotype M3 genomes. As a population, 65% of SNP loci (525/801) and 10% of the SNPs (525/5,243) are strain specific. The vast majority of SNP loci are present in only one or just a few strains. Individually, each strain has on average ∼6 unique SNPs (range, 0–47 SNPs) and ∼41 informative SNPs (range, 10–70 SNPs) in the core genome relative to the others.
Fig. 2.
Fig. 2.
Model summarizing changes in M3 subclones over time. The frequency distribution of all strains in the three epidemics is shown in gray, with three peaks of infection centered around 1995, 2000, and 2005. Ten major subclones (SC-1 to SC-10) were identified among the 344 strains collected from 1992 through 2007 based on a 15-SNP haplotype, prophage content, and emm3 allele (as given in Table S1). SC-9 is inset within SC-1 in the third peak to indicate that at this level of genetic interrogation they are nearly identical, differing by a single synonymous polymorphism in emm3, and therefore produce M proteins that have the same amino terminal sequence. The widths of the colored SC symbols show the temporal distribution of the SCs, and the heights are proportional to the annual abundance. Arrows between SCs indicate estimated relationships and give differences found in the loci assessed. The total number of isolates per year is given above the time line at the bottom.
Fig. 3.
Fig. 3.
Genetic relationships among serotype M3 strains. (A) Neighbor-joining tree for 95 sequenced strains based on 276 informative SNPs. Nodes of the tree are color coded by subclone as shown in the legend. (B) Neighbor-joining tree for 344 invasive strains (plus reference strain MGAS315, red star, haplotype 54) based on 280 sequence-validated biallelic SNPs. The 97 haplotypes (numbers in italics) defined by the concatenated SNP sequences are illustrated on the tree as color-coded circles that have areas proportional to the number of strains represented. Clonal complexes (CCs) of related haplotypes (CC-1 to CC-21) are indicated, with grouped haplotypes, and the number of strains encompassed is given for each complex. Haplotypes and clonal complexes are color coded by subclone as shown in the legend. The topologies of the trees in A and B are analogous; common to both are four major branches similar in composition, separation, and length.
Fig. 4.
Fig. 4.
Identification of GAS genes with significantly increased nucleotide diversity. (A) Illustrated is the distribution of χ2 statistic determined for observed versus expected numbers of SNPs for all 1,549 core genes. Indicated are known virulence genes with nucleotide diversity significantly exceeding mean chance expectation (P ≤ 0.05; χ2 adjusted for multiple testing). (B) Schematic of RopB showing locations of inferred amino acid changes. HTH, predicted DNA-binding helix-turn-helix motif.
Fig. 5.
Fig. 5.
Phylogeographic structure. (A) Plotted for the sequenced genomes are the mean spatial distances between invasive infection cases versus the number of core nucleotide differences. Shown is a locally weighted least-squares fit (LOWESS; n = 33) of the data. In general, geographic distance between the cases increased with genetic distance between strains (P = 0.0005; Spearman’s test). (B) The distribution of mean spatial distances separating invasive infection cases, calculated pairwise for all strains within a clonal complex (intra CC), and similarly for all strains that are of different clonal complexes (inter CC). In general, the geographic distance separating strains of the same CC is significantly less (∼70 km, on average) than that separating strains of different CCs (P = 0.025; Mann-Whitney test).
Fig. 6.
Fig. 6.
Comparative transcriptome analysis. The four strains analyzed were each genetically representative of four numerically dominant subclones, as labeled for each lane. Microarray analysis was performed in triplicate on samples harvested at midexponential and stationary phases of growth. The heat map illustrates genes significantly (P ≤ 0.05; ANOVA) changed in expression at each time point. In total, 281 genes had altered transcripts, with 112 genes showing changes at both time points.

Similar articles

Cited by

References

    1. Holt KE, et al. High-throughput sequencing provides insights into genome variation and evolution in Salmonella Typhi. Nat Genet. 2008;40:987–993. - PMC - PubMed
    1. MacLean D, Jones JD, Studholme DJ. Application of ‘next-generation’ sequencing technologies to microbial genetics. Nat Rev Microbiol. 2009;7:287–296. - PubMed
    1. Orsi RH, et al. Short-term genome evolution of Listeria monocytogenes in a non-controlled environment. BMC Genomics. 2008;9:539. - PMC - PubMed
    1. Shendure J, Ji H. Next-generation DNA sequencing. Nat Biotechnol. 2008;26:1135–1145. - PubMed
    1. Carapetis JR, Steer AC, Mulholland EK, Weber M. The global burden of group A streptococcal diseases. Lancet Infect Dis. 2005;5:685–694. - PubMed

Publication types

Substances