. 2010 Mar;135(3):197-215.
doi: 10.1085/jgp.200910308. Epub 2010 Feb 8.

Molecular endpoints of Ca2+/calmodulin- and voltage-dependent inactivation of Ca(v)1.3 channels

Affiliations

Molecular endpoints of Ca2+/calmodulin- and voltage-dependent inactivation of Ca(v)1.3 channels

Michael R Tadross et al. J Gen Physiol. 2010 Mar.

Abstract

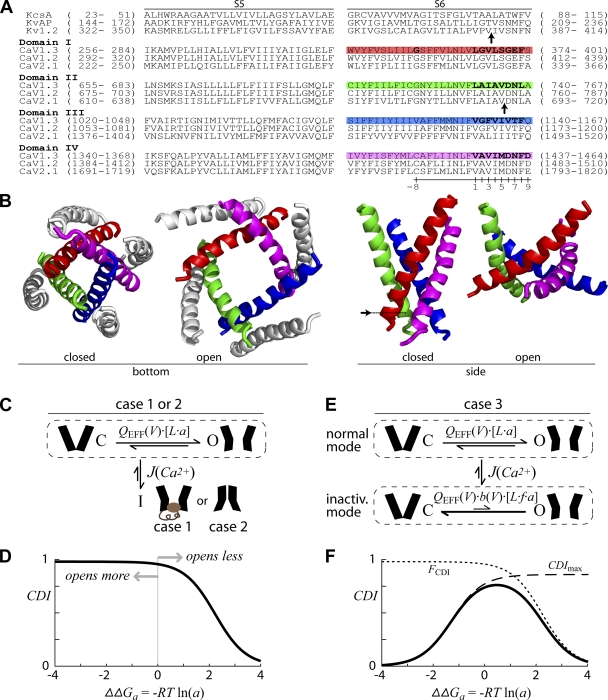
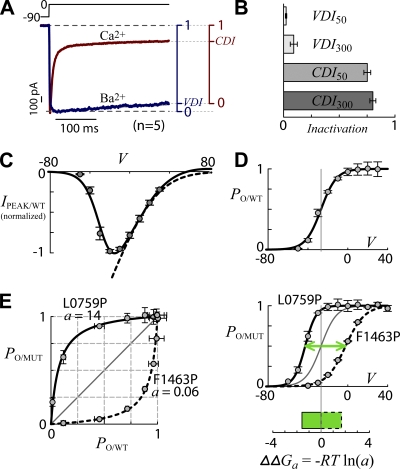
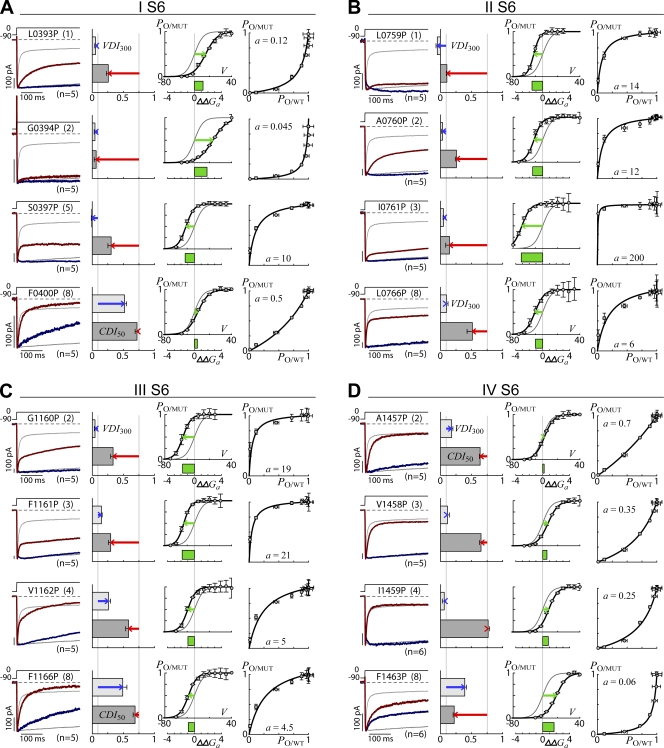
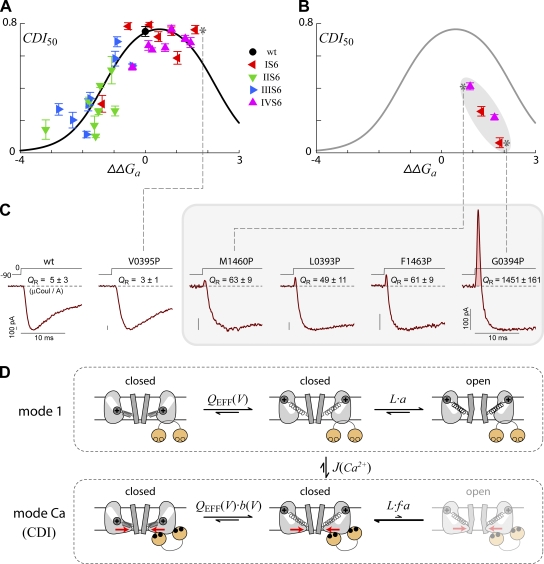
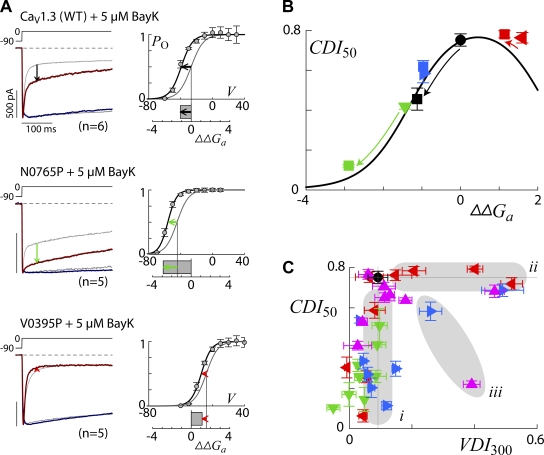
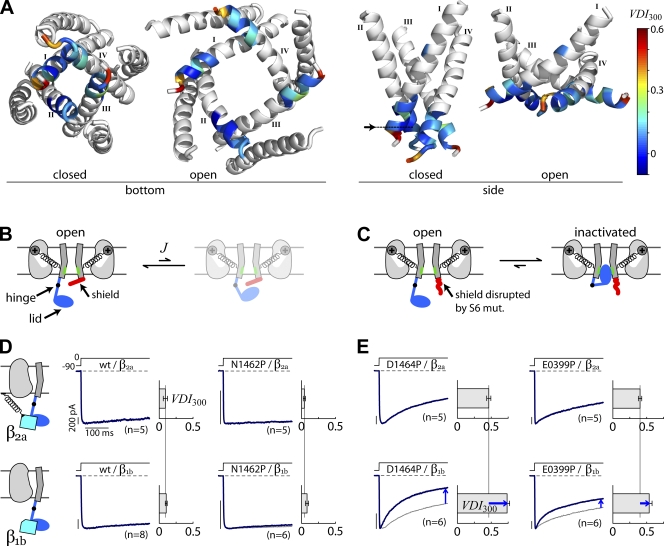
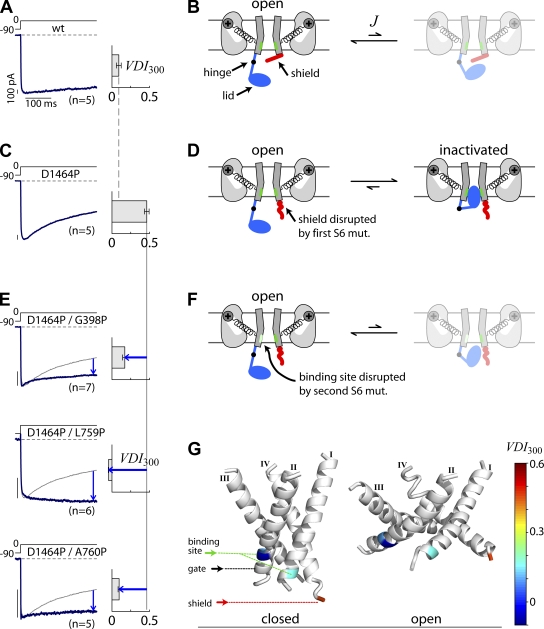
Ca(2+)/calmodulin- and voltage-dependent inactivation (CDI and VDI) comprise vital prototypes of Ca(2+) channel modulation, rich with biological consequences. Although the events initiating CDI and VDI are known, their downstream mechanisms have eluded consensus. Competing proposals include hinged-lid occlusion of channels, selectivity filter collapse, and allosteric inhibition of the activation gate. Here, novel theory predicts that perturbations of channel activation should alter inactivation in distinctive ways, depending on which hypothesis holds true. Thus, we systematically mutate the activation gate, formed by all S6 segments within Ca(V)1.3. These channels feature robust baseline CDI, and the resulting mutant library exhibits significant diversity of activation, CDI, and VDI. For CDI, a clear and previously unreported pattern emerges: activation-enhancing mutations proportionately weaken inactivation. This outcome substantiates an allosteric CDI mechanism. For VDI, the data implicate a "hinged lid-shield" mechanism, similar to a hinged-lid process, with a previously unrecognized feature. Namely, we detect a "shield" in Ca(V)1.3 channels that is specialized to repel lid closure. These findings reveal long-sought downstream mechanisms of inactivation and may furnish a framework for the understanding of Ca(2+) channelopathies involving S6 mutations.


Figures

Figure 1.
Figure 1.
Structural and functional models of S6 domains. (A) CLUSTAL alignment of S5–S6 domains of three K+ channels with known crystal structures (top) and the four domains of CaV1.3, CaV1.2, and CaV2.1. Arrows indicate putative location of the intracellular S6 gate, as determined from previous cysteine accessibility studies. CaV1.3 residues in bold indicate sites that were mutated to proline in this study. Colored highlights correspond to the color scheme used in B. Numbered scale defines a common set of “S6 coordinates” for ease of reference. (B) Structural homology model of CaV1.3 S5/S6 segments, based on KcsA (closed) and KvAP (open). Bottom and side views are shown. Arrow in the closed side view corresponds to the gate identified in A. (C and D) Theory of S6 mutation effects on a hinged-lid or selectivity filter collapse mechanism. In C, channels activate via a C↔O transition governed by voltage-sensing term QEFF(V) and concerted gate-opening term L. Partitioning between normal and inactivated modes is driven by Ca2+ influx through the channel and is governed by J(Ca2+) ≈ PO-PEAK/Keff. Note that these equilibrium coefficients represent the ratio of forward and reverse kinetic rate constants, which are not individually defined. (D) The predicted outcome if S6 mutations selectively perturb L by the factor a. Eq. 4 was used with parameters: QEFF(V) · L = 0.8; 1/Keff = 50. R · T = 0.6 kCal/mole throughout. (E and F) Theory of S6 mutation effects on an allosteric CDI mechanism. Channels occupy either a normal (top row of E) or inactivated gating mode (bottom row). In both modes, channels activate via a C↔O scheme as defined in C; however, channels in the inactivated mode open less often because f < 1. Partitioning between normal and inactivated modes is driven by Ca2+ influx through the channel as in C. (E) The predicted outcome if S6 mutations selectively perturb L by the factor a. CDI (solid curve) is the product of two terms: FCDI (dotted line) and CDImax (dashed line). Eq. 5 was used with parameters: QEFF(V) · L = 0.8, 1/Keff = 50, and f · b(V) = 0.14.
Figure 2.
Figure 2.
Baseline CaV1.3 behavior and method of calculating ΔΔGa. (A) Whole cell Ba2+ (blue) and Ca2+ (red) currents of CaV1.3 coexpressed with α2δ and β2a, evoked by depolarization to 0 mV. Voltage pulse protocol (in mV) indicated above data trace here and throughout. Current scale bar is for Ca2+; Ba2+ is scaled down approximately two to three times to match. Scales to the right define VDI and CDI metrics. See Materials and methods for details. (B) VDI and CDI (as defined in A) calculated after 50 and 300 ms of depolarization and averaged over many cells. Cell number (n) in A. Error bars are SEM. (C) Normalized IPEAK(V) relationship (see Materials and methods for details). Voltage (V) is in units of mV. Dashed relationship is proportional to the unitary current (before additional nonlinear leak correction). Cell number (n) in A. Error bars are SEM. (D) PO-PEAK(V), calculated by taking the ratio of data points from C and the leak-corrected unitary current relation. This yields the relative open probability (normalized to maximum PO). Error bars are SEM from C divided by the unitary current relation. (E) Method for determining ΔΔGa. Graph on the left illustrates the determination of parameter a via Eq. 6. Top right graph follows the format of D, where V is in units of mV. ΔΔGa (bottom right graph) is in units of kCal/mole. See Results for details.
Figure 3.
Figure 3.
Functional profiles for systematic S6 mutagenesis scan. (A–D) Data are organized into four panels, where each panel corresponds to a channel domain (IS6, IIS6, IIIS6, and IVS6). Within a panel, each row corresponds to data from a CaV1.3 proline mutant coexpressed with α2δ and β2a. The format for each construct follows that in Fig. 2. For clarity, only a subset of our mutagenesis screen is displayed. The complete set of S6 mutations is numerically summarized in Table II and graphically displayed in Fig. S1. Exemplar traces (left column) show Ba2+ (blue) and Ca2+ (red) currents for the mutant channel, with the native channel behavior overlaid in light gray for reference. Voltage pulse protocol and mutated residue (identified by name and common S6 coordinate, as defined in Fig. 1 A) are indicated above data traces. For VDI and CDI metrics (second column), native channel values are indicated by the vertical gray lines, and deviation from native channel behavior is indicated by colored arrows. This is also done for the voltage-activation relations (third column), which show both ΔΔGa (bars) and ΔV1/2 (arrows). The fourth column shows fits for ΔΔGa determination, as done in Fig. 2 E (left). Axis labels are shown only for top and bottom rows, with identical format throughout.
Figure 4.
Figure 4.
Implications of S6 mutagenesis scan for endpoint mechanism of CDI. (A and B) CDI50 versus ΔΔGa for our CaV1.3 mutant library. Symbol color and shape as in legend. Error bars are SEM. Overlaid are the model results identical to Fig. 1 F. (C) Gating currents of channels that fall on (left) and off (right, gray shaded) the predicted CDI-ΔΔGa relation. QR is the ratio of gating current area (e.g., pink shaded area of G0394P) to peak ionic current (units of μCoul/A). The mean ± SEM is shown for each construct. (D) CDI occurs via an allosteric mechanism. Channels occupy either a normal (top row) or inactivated gating mode (bottom row). In either mode, channel activation begins with voltage sensor (+) movement (governed by QEFF(V)) and ends with S6 gate opening (governed by L). Outward voltage sensor displacement promotes S6 gate opening (depicted with springs). CaM (yellow dumbbell) binds Ca2+ (black dots in bottom row) and initiates CDI by interacting with a channel site distinct from the S6 gate. This causes a conformational change (red arrows) that inhibits S6 gate opening (i.e., parameter f < 1). Thus, voltage and Ca2+ ultimately exert opposing actions on the same S6 gate.
Figure 5.
Figure 5.
Further implications of S6 mutagenesis scan for endpoint mechanism of CDI. (A) Behavior of wild-type CaV1.3 (top row), N0765P (middle), and V0395P (bottom) channels coexpressed with α2δ and β2a in 5 µM Bay K 8644. Gray traces show corresponding drug-free behavior. Colored arrows indicate change resulting from Bay K. (B) CDI50 versus ΔΔGa of wild-type CaV1.3 (black symbols), N0765P (green symbols), V0395P (red symbols), and V1162P (blue symbols); each construct is plotted both in the absence (circle or triangles) and presence (squares) of Bay K. (C) CDI50 versus VDI300 for our CaV1.3 mutant library. Symbol color and shape as in Fig. 4 A. Data are clustered into three main zones, which are discussed in the Results.
Figure 6.
Figure 6.
Mechanistic insights for VDI. (A) VDI perturbations mapped onto the CaV1.3 homology model from Fig. 1 B. Residues outside of mutagenesis screen shown in gray. Colored regions indicate VDI300 upon mutation to proline. See color legend to right, and note that native channel VDI300 is ∼0.1 (blue). (B and C) Proposed mechanism of VDI in CaV1.3. Native channels (B) have very little VDI, likely due to the presence of a shield (red), which prevents the hinged lid (blue) from reaching its binding site (green). VDI-enhancing S6 mutations likely disrupt this shield (C). (D and E) Sensitivity of VDI to β subunits supports the notion of a shield in CaV1.3. Although β1b typically enhances VDI by allowing greater hinged-lid mobility than β2a (cartoon in D), native CaV1.3 and non-hotspot mutant N1462P have no such effect (D). In contrast, if the putative shield is perturbed (two mutants in E), β1b significantly enhances VDI.
Figure 7.
Figure 7.
Further mechanistic insights for VDI. (A–D) Review of proposed shield structure. In A and B, native CaV1.3 channels have very little VDI, likely due to the presence of a shield (red) that prevents the hinged lid (blue) from reaching its binding site (green). Conversely, in C and D, shield-disrupting mutation D1464P enhances VDI, even when coexpressed with α2δ and β2a, here and subsequently. (E and F) Evidence that an underlying hinged-lid mechanism exists in CaV1.3. Given a baseline shield-disrupting D1464P mutation, additional mutations at sites homologous to those previously identified as a hinged-lid binding site (green) significantly diminish VDI. The G398P mutation is analogous to the CaV1.2 G406R mutation that underlies forms of Timothy syndrome, and the L0759P and A0760P mutations in IIS6 correspond to rabbit CaV1.2 receptor sites at L0779 and A0780. (G) Structural model of components underlying the hinged lid–shield mechanism. VDI for the constructs in C and E are mapped onto our CaV1.3 homology model. The pronounced VDI of D1464P (red residue) indicates the shield location below the putative gate (identified by black arrow). The loss of this VDI upon mutation of additional residues (blue and cyan) identifies the location of the proposed hinged-lid binding site (identified by green arrow) above the gate. These binding site residues move considerably in the open versus closed conformations, consistent with preferential open-state accessibility.

Comment in

References

    1. Adams P.J., Garcia E., Snutch T.P., Spacey S.D.. 2007. Splice variant composition of P/Q-type calcium channels affects both biophysical properties and sensitivity to an FHM point mutation. Biophys. J. Abstr 2869:602A.
    1. Agler H.L., Evans J., Tay L.H., Anderson M.J., Colecraft H.M., Yue D.T.. 2005. G protein-gated inhibitory module of N-type (ca(v)2.2) ca2+ channels. Neuron. 46:891–904. 10.1016/j.neuron.2005.05.011 - DOI - PubMed
    1. Armstrong C.M., Bezanilla F.. 1977. Inactivation of the sodium channel. II. Gating current experiments. J. Gen. Physiol. 70:567–590. 10.1085/jgp.70.5.567 - DOI - PMC - PubMed
    1. Babich O., Isaev D., Shirokov R.. 2005. Role of extracellular Ca2+ in gating of CaV1.2 channels. J. Physiol. 565:709–715. 10.1113/jphysiol.2005.086561 - DOI - PMC - PubMed
    1. Babich O., Reeves J., Shirokov R.. 2007. Block of CaV1.2 channels by Gd3+ reveals preopening transitions in the selectivity filter. J. Gen. Physiol. 129:461–475. 10.1085/jgp.200709733 - DOI - PMC - PubMed

Publication types