

Heritable and non-genetic factors as variables of pharmacologic phenotypes in lymphoblastoid cell lines
- PMID: 20142840
- PMCID: PMC2975793
- DOI: 10.1038/tpj.2010.3
Heritable and non-genetic factors as variables of pharmacologic phenotypes in lymphoblastoid cell lines
Abstract
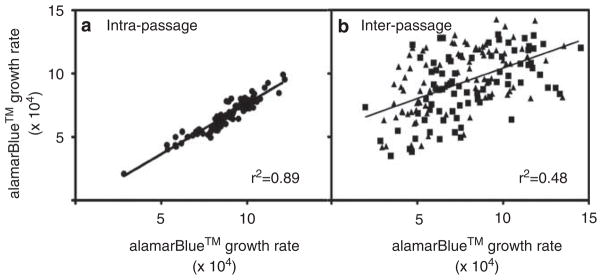
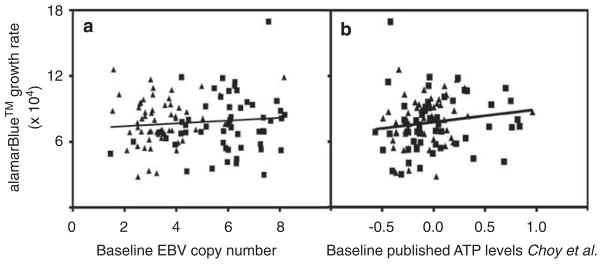
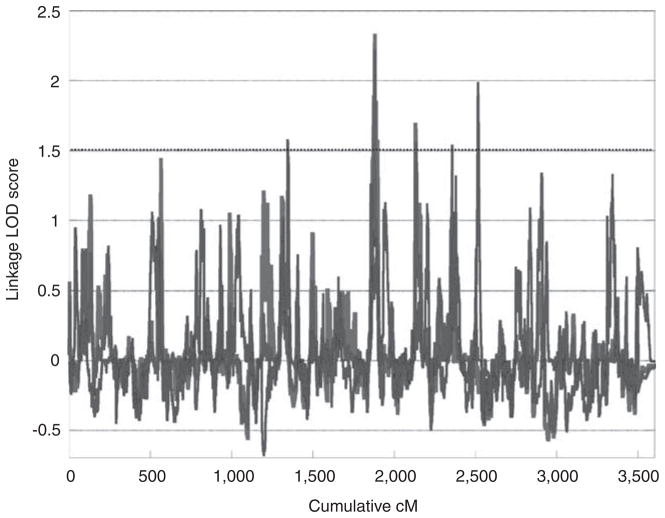
Publicly available genetic and expression data on lymphoblastoid cell lines (LCLs) make them a unique resource for understanding the genetic underpinnings of pharmacological outcomes and disease. LCLs have been used for pharmacogenomic discovery and validation of clinical findings associated with drug response. However, variation in cellular growth rate, baseline Epstein-Barr virus (EBV) copy number and ATP levels can all be confounders in such studies. Our objective is to better define confounding variables that affect pharmacological end points in LCLs. To this end, we evaluated the effect of these three variables on drug-induced cytotoxicity in LCLs. The drugs evaluated included daunorubicin, etoposide, carboplatin, cisplatin, cytarabine, pemetrexed, 5'-deoxyfluorouridine, vorinostat, methotrexate, 6-mercaptopurine, and 5-fluorouracil. Baseline ATP or EBV copy number were not significantly correlated with cellular growth rate or drug-induced cytotoxicity. In contrast, cellular growth rate and drug-induced cytotoxicity were significantly, directly related for all drugs except vorinostat. Importantly, cellular growth rate is under appreciable genetic influence (h²=0.30-0.39) with five suggestive linkage regions across the genome. Not surprisingly, a percentage of SNPs that significantly associate with drug-induced cytotoxicity also associate with cellular growth rate (P ≤ 0.0001). Studies using LCLs for pharmacologic outcomes should therefore consider that a portion of the genetic variation explaining drug-induced cytotoxicity is mediated via heritable effects on growth rate.
Conflict of interest statement
The authors declare no conflict of interest.
Figures
Similar articles
-
Chemotherapeutic-induced apoptosis: a phenotype for pharmacogenomics studies.Pharmacogenet Genomics. 2011 Aug;21(8):476-88. doi: 10.1097/FPC.0b013e3283481967. Pharmacogenet Genomics. 2011. PMID: 21642893 Free PMC article.
-
Host genetic variants and gene expression patterns associated with Epstein-Barr virus copy number in lymphoblastoid cell lines.PLoS One. 2014 Oct 7;9(10):e108384. doi: 10.1371/journal.pone.0108384. eCollection 2014. PLoS One. 2014. PMID: 25290448 Free PMC article.
-
RNA Sequencing Analyses of Gene Expression during Epstein-Barr Virus Infection of Primary B Lymphocytes.J Virol. 2019 Jun 14;93(13):e00226-19. doi: 10.1128/JVI.00226-19. Print 2019 Jul 1. J Virol. 2019. PMID: 31019051 Free PMC article.
-
Lymphoblastoid cell lines in pharmacogenomic discovery and clinical translation.Pharmacogenomics. 2012 Jan;13(1):55-70. doi: 10.2217/pgs.11.121. Pharmacogenomics. 2012. PMID: 22176622 Free PMC article. Review.
-
Use of CEPH and non-CEPH lymphoblast cell lines in pharmacogenetic studies.Pharmacogenomics. 2005 Apr;6(3):303-10. doi: 10.1517/14622416.6.3.303. Pharmacogenomics. 2005. PMID: 16013961 Review.
Cited by
-
Extensive epigenetic and transcriptomic variability between genetically identical human B-lymphoblastoid cells with implications in pharmacogenomics research.Sci Rep. 2019 Mar 20;9(1):4889. doi: 10.1038/s41598-019-40897-9. Sci Rep. 2019. PMID: 30894562 Free PMC article.
-
Single-cell RNA-seq reveals transcriptomic heterogeneity mediated by host-pathogen dynamics in lymphoblastoid cell lines.Elife. 2021 Jan 27;10:e62586. doi: 10.7554/eLife.62586. Elife. 2021. PMID: 33501914 Free PMC article.
-
The impact of microRNA expression on cellular proliferation.Hum Genet. 2014 Jul;133(7):931-8. doi: 10.1007/s00439-014-1434-4. Epub 2014 Mar 8. Hum Genet. 2014. PMID: 24609542 Free PMC article.
-
Integration of cell line and clinical trial genome-wide analyses supports a polygenic architecture of Paclitaxel-induced sensory peripheral neuropathy.Clin Cancer Res. 2013 Jan 15;19(2):491-9. doi: 10.1158/1078-0432.CCR-12-2618. Epub 2012 Nov 30. Clin Cancer Res. 2013. PMID: 23204130 Free PMC article.
-
Using germline genomics to individualize pediatric cancer treatments.Clin Cancer Res. 2012 May 15;18(10):2791-800. doi: 10.1158/1078-0432.CCR-11-1938. Clin Cancer Res. 2012. PMID: 22589487 Free PMC article. Review.
References
Publication types
MeSH terms
Substances
Grants and funding
LinkOut - more resources
Full Text Sources
Other Literature Sources
