

Cortical responses to consciousness of schematic emotional facial expressions: a high-resolution EEG study
- PMID: 20143385
- PMCID: PMC6871096
- DOI: 10.1002/hbm.20958
Cortical responses to consciousness of schematic emotional facial expressions: a high-resolution EEG study
Abstract
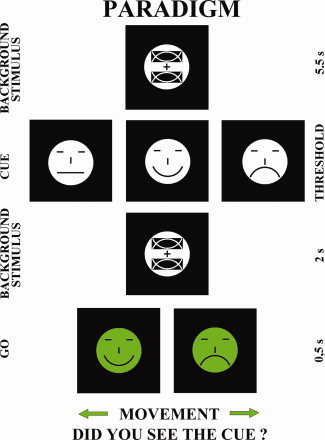
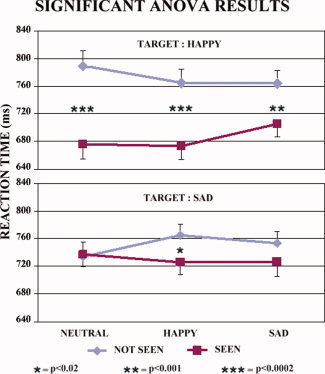
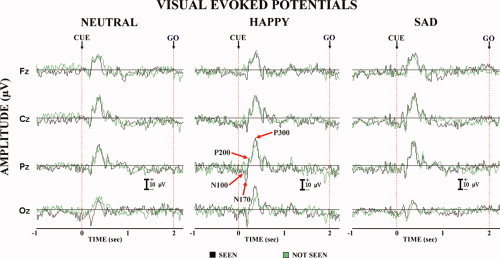
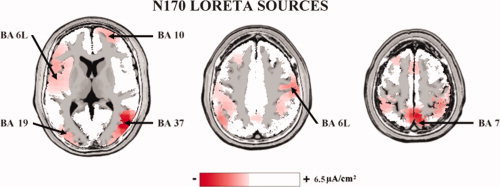
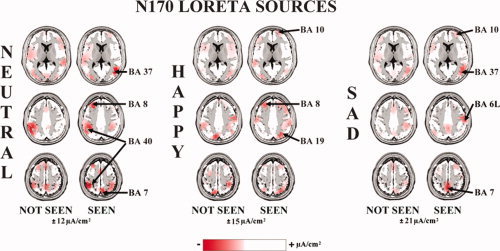
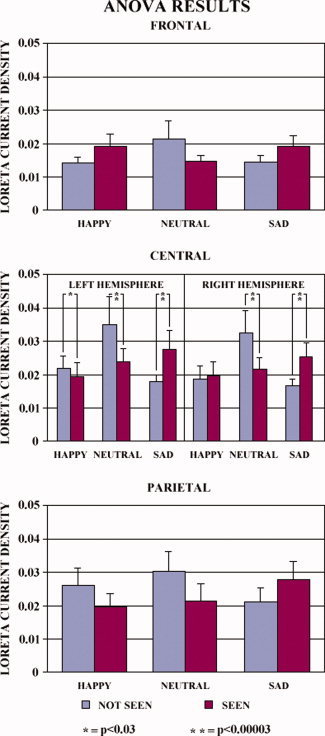
Is conscious perception of emotional face expression related to enhanced cortical responses? Electroencephalographic data (112 channels) were recorded in 15 normal adults during the presentation of cue stimuli with neutral, happy or sad schematic faces (duration: "threshold time" inducing about 50% of correct recognitions), masking stimuli (2 s), and go stimuli with happy or sad schematic faces (0.5 s). The subjects clicked left (right) mouse button in response to go stimuli with happy (sad) faces. After the response, they said "seen" or "not seen" with reference to previous cue stimulus. Electroencephalographic data formed visual event-related potentials (ERPs). Cortical sources of ERPs were estimated by LORETA software. Reaction time to go stimuli was generally shorter during "seen" than "not seen" trials, possibly due to covert attention and awareness. The cue stimuli evoked four ERP components (posterior N100, N170, P200, and P300), which had similar peak latency in the "not seen" and "seen" ERPs. Only N170 amplitude showed differences in amplitude in the "seen" versus "not seen" ERPs. Compared to the "not seen" ERPs, the "seen" ones showed prefrontal, premotor, and posterior parietal sources of N170 higher in amplitude with the sad cue stimuli and lower in amplitude with the neutral and happy cue stimuli. These results suggest that nonconscious and conscious processing of schematic emotional facial expressions shares a similar temporal evolution of cortical activity, and conscious processing induces an early enhancement of bilateral cortical activity for the schematic sad facial expressions (N170).
© 2010 Wiley-Liss, Inc.
Figures
Similar articles
-
Visuo-spatial consciousness and parieto-occipital areas: a high-resolution EEG study.Cereb Cortex. 2006 Jan;16(1):37-46. doi: 10.1093/cercor/bhi082. Epub 2005 Mar 30. Cereb Cortex. 2006. PMID: 15800023 Clinical Trial.
-
Faces emotional expressions: from perceptive to motor areas in aged and young subjects.J Neurophysiol. 2021 Nov 1;126(5):1642-1652. doi: 10.1152/jn.00328.2021. Epub 2021 Oct 6. J Neurophysiol. 2021. PMID: 34614362
-
Cortical sources of visual evoked potentials during consciousness of executive processes.Hum Brain Mapp. 2009 Mar;30(3):998-1013. doi: 10.1002/hbm.20567. Hum Brain Mapp. 2009. PMID: 18465752 Free PMC article.
-
Neurophysiological correlates of emotional face perception consciousness.Neuropsychologia. 2020 Sep;146:107554. doi: 10.1016/j.neuropsychologia.2020.107554. Epub 2020 Jul 8. Neuropsychologia. 2020. PMID: 32652090
-
Meanness and affective processing: A meta-analysis of EEG findings on emotional face processing in individuals with psychopathic traits.Biol Psychol. 2024 Mar;187:108764. doi: 10.1016/j.biopsycho.2024.108764. Epub 2024 Feb 11. Biol Psychol. 2024. PMID: 38350594 Review.
Cited by
-
Mapping the time course of the positive classification advantage: an ERP study.Cogn Affect Behav Neurosci. 2013 Sep;13(3):491-500. doi: 10.3758/s13415-013-0158-6. Cogn Affect Behav Neurosci. 2013. PMID: 23504806
-
On consciousness, resting state fMRI, and neurodynamics.Nonlinear Biomed Phys. 2010 Jun 3;4 Suppl 1(Suppl 1):S9. doi: 10.1186/1753-4631-4-S1-S9. Nonlinear Biomed Phys. 2010. PMID: 20522270 Free PMC article.
-
Long-range synchrony of γ oscillations and auditory hallucination symptoms in schizophrenia.Int J Psychophysiol. 2011 Jan;79(1):55-63. doi: 10.1016/j.ijpsycho.2010.08.004. Epub 2010 Aug 14. Int J Psychophysiol. 2011. PMID: 20713096 Free PMC article.
-
Cortical Neural Synchronization Underlies Primary Visual Consciousness of Qualia: Evidence from Event-Related Potentials.Front Hum Neurosci. 2016 Jun 30;10:310. doi: 10.3389/fnhum.2016.00310. eCollection 2016. Front Hum Neurosci. 2016. PMID: 27445750 Free PMC article. Review.
-
Positive Classification Advantage: Tracing the Time Course Based on Brain Oscillation.Front Hum Neurosci. 2018 Jan 11;11:659. doi: 10.3389/fnhum.2017.00659. eCollection 2017. Front Hum Neurosci. 2018. PMID: 29375353 Free PMC article.
References
-
- Babiloni F, Babiloni C, Fattorini L, Carducci F, Onorati P, Urbano A ( 1995): Performances of surface Laplacian estimators: A study of simulated and real scalp potential distributions. Brain Topogr 8: 35–45. - PubMed
-
- Babiloni C, Vecchio F, Miriello M, Romani GL, Rossini PM ( 2006a): Visuo‐spatial consciousness and parieto‐occipital areas: A high‐resolution EEG study. Cereb Cortex 16: 37–46. - PubMed
-
- Babiloni C, Vecchio F, Rossi S, De Capua A, Bartalini S, Ulivelli M, Rossini PM ( 2007): Human ventral parietal cortex plays a functional role on visuospatial attention and primary consciousness. A repetitive transcranial magnetic stimulation study. Cereb Cortex 17: 1486–1492. - PubMed
-
- Balconi M, Lucchiari C ( 2005): In the face of emotions: Event‐related potentials in supraliminal and subliminal face expression recognition. Genet Soc Gen Psychol Monogr 131: 41–69. - PubMed
Publication types
MeSH terms
LinkOut - more resources
Full Text Sources
Miscellaneous
