

High-resolution spectral analysis of individual SERS-active nanoparticles in flow
- PMID: 20143808
- PMCID: PMC2861152
- DOI: 10.1021/ja909850s
High-resolution spectral analysis of individual SERS-active nanoparticles in flow
Abstract
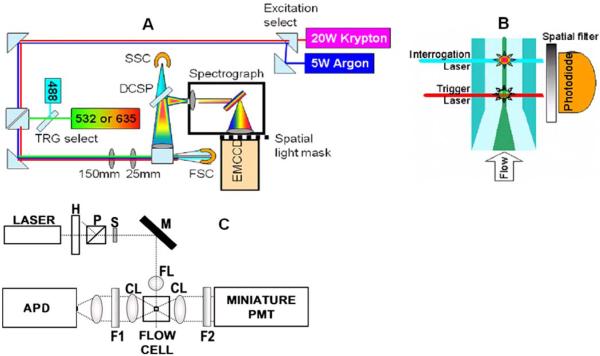
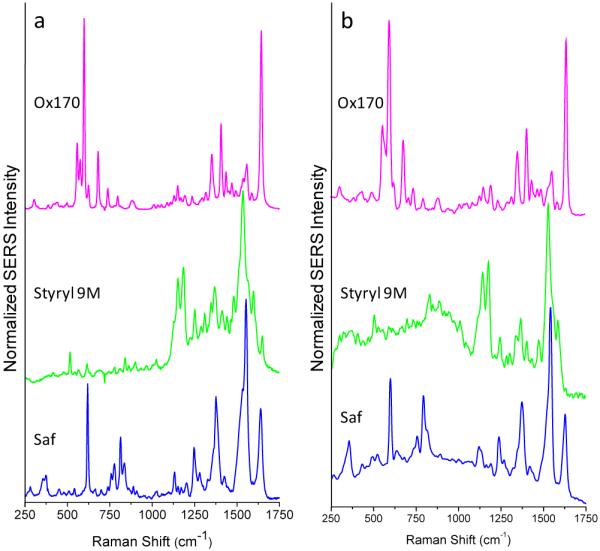
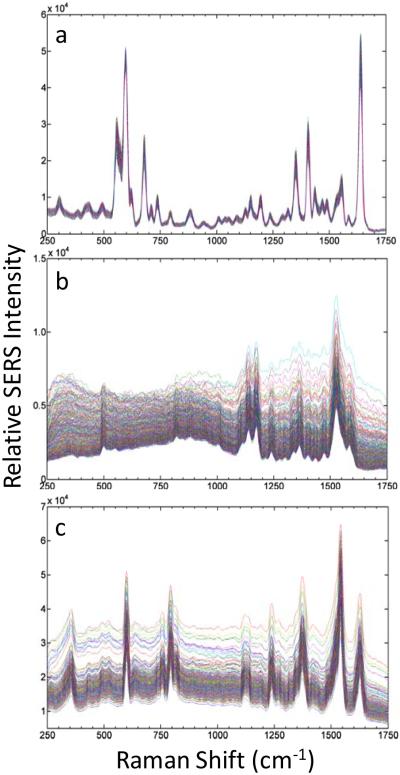
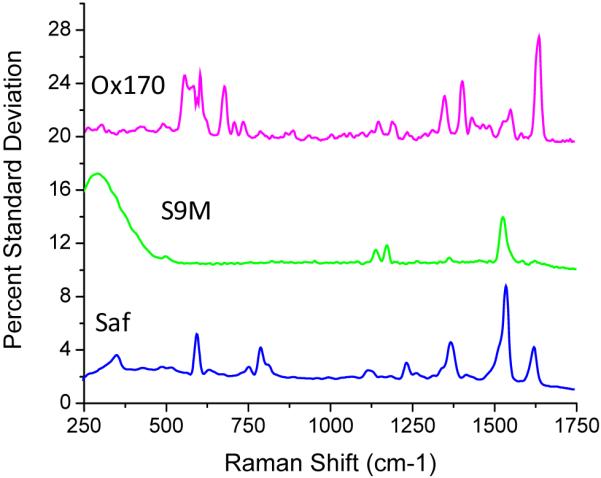
Nanoparticle spectroscopic tags based on surface enhanced Raman scattering (SERS) are playing an increasingly important role in bioassay and imaging applications. The ability to rapidly characterize large populations of such tags spectroscopically in a high-throughput flow-based platform will open new areas for their application and provide new tools for advancing their development. We demonstrate here a high-resolution spectral flow cytometer capable of acquiring Raman spectra of individual SERS-tags at flow rates of hundreds of particles per second, while maintaining the spectral resolution required to make full use of the detailed information encoded in the Raman signature for advanced multiplexing needs. The approach allows multiple optical parameters to be acquired simultaneously over thousands of individual nanoparticle tags. Characteristics such as tag size, brightness, and spectral uniformity are correlated on a per-particle basis. The tags evaluated here display highly uniform spectral signatures, but with greater variability in brightness. Subpopulations in the SERS response, not apparent in ensemble measurements, are also shown to exist. Relating tag variability to synthesis parameters makes flow-based spectral characterization a powerful tool for advancing particle development through its ability to provide rapid feedback on strategies aimed at constraining desired tag properties. Evidence for single-tag signal saturation at high excitation power densities is also shown, suggesting a role for high-throughput investigation of fundamental properties of the SERS tags as well.
Figures
Similar articles
-
Single cell analysis using surface enhanced Raman scattering (SERS) tags.Methods. 2012 Jul;57(3):272-9. doi: 10.1016/j.ymeth.2012.03.024. Epub 2012 Apr 4. Methods. 2012. PMID: 22498143 Free PMC article. Review.
-
High throughput single nanoparticle spectroscopy.ACS Nano. 2009 Jun 23;3(6):1477-84. doi: 10.1021/nn9003346. ACS Nano. 2009. PMID: 19472989 Free PMC article.
-
A flow cytometer for the measurement of Raman spectra.Cytometry A. 2008 Feb;73(2):119-28. doi: 10.1002/cyto.a.20520. Cytometry A. 2008. PMID: 18189283
-
Optimization of SERS tag intensity, binding footprint, and emittance.Bioconjug Chem. 2014 Jul 16;25(7):1233-42. doi: 10.1021/bc5000252. Epub 2014 Jun 10. Bioconjug Chem. 2014. PMID: 24892497 Free PMC article.
-
Single-molecule and single-nanoparticle SERS: from fundamental mechanisms to biomedical applications.Chem Soc Rev. 2008 May;37(5):912-20. doi: 10.1039/b708839f. Epub 2008 Mar 26. Chem Soc Rev. 2008. PMID: 18443676 Review.
Cited by
-
Magnetic barcode assay for genetic detection of pathogens.Nat Commun. 2013;4:1752. doi: 10.1038/ncomms2745. Nat Commun. 2013. PMID: 23612293 Free PMC article.
-
The sensitive detection of methylene blue using silver nanodecahedra prepared through a photochemical route.RSC Adv. 2020 Oct 23;10(64):38974-38988. doi: 10.1039/d0ra07869g. eCollection 2020 Oct 21. RSC Adv. 2020. PMID: 35518425 Free PMC article.
-
Gap-enhanced Raman tags: fabrication, optical properties, and theranostic applications.Theranostics. 2020 Jan 12;10(5):2067-2094. doi: 10.7150/thno.39968. eCollection 2020. Theranostics. 2020. PMID: 32089735 Free PMC article. Review.
-
Acoustic Separation of Nanoparticles in Continuous Flow.Adv Funct Mater. 2017 Apr 11;27(14):1606039. doi: 10.1002/adfm.201606039. Epub 2017 Mar 3. Adv Funct Mater. 2017. PMID: 29104525 Free PMC article.
-
Advantages of full spectrum flow cytometry.J Biomed Opt. 2013 Mar;18(3):037004. doi: 10.1117/1.JBO.18.3.037004. J Biomed Opt. 2013. PMID: 23478809 Free PMC article.
References
-
- Watson DA, Brown LO, Gaskill DF, Naivar M, Graves SW, Doorn SK, Nolan JP. Cytometry A. 2008;73A:119–128. - PubMed
-
- Cao YC, Jin R, Mirkin CA. Science. 2002;297:1536–1540. - PubMed
-
- Graham D, Thompson DG, Smith WE, Faulds K. Nat. Nanotech. 2008;3:548–551. - PubMed
-
- Wabuyele MB, Vo-Dinh T. Anal. Chem. 2005;77:7810–7815. - PubMed
Publication types
MeSH terms
Grants and funding
LinkOut - more resources
Full Text Sources
Other Literature Sources
Miscellaneous
