

The folding energy landscape and free energy excitations of cytochrome c
- PMID: 20143816
- PMCID: PMC4145804
- DOI: 10.1021/ar9002703
The folding energy landscape and free energy excitations of cytochrome c
Abstract
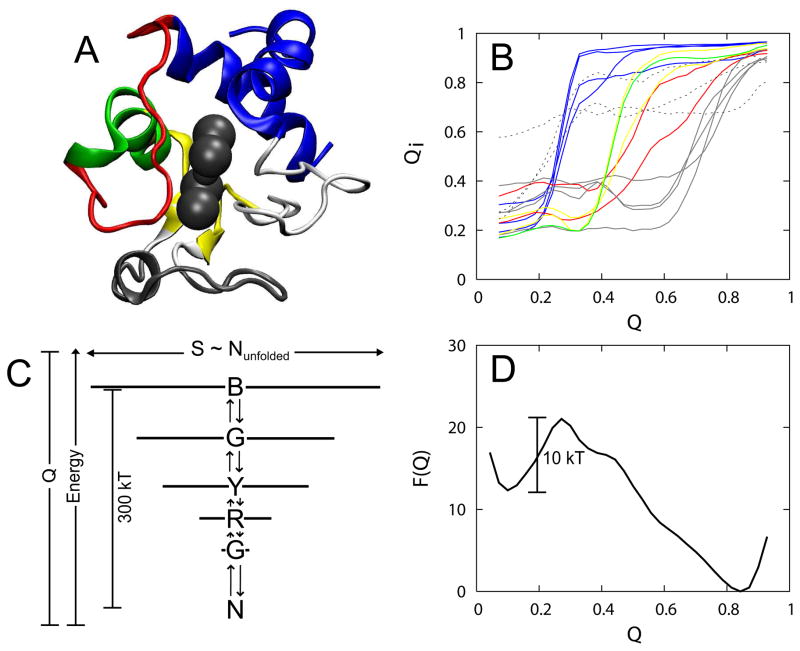
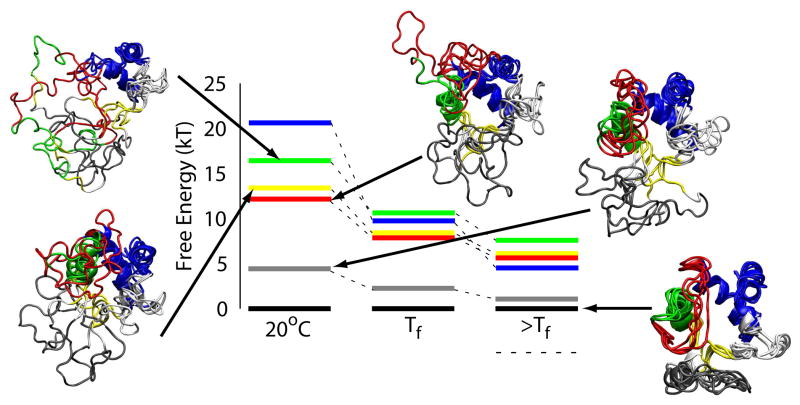
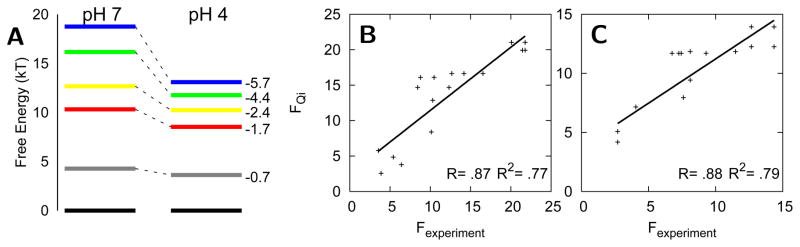
The covalently bound heme cofactor plays a dominant role in the folding of cytochrome c. Because of the complicated inorganic chemistry of the heme, some might consider the folding of cytochrome c to be a special case, following principles different from those used to describe the folding of proteins without cofactors. Recent investigations, however, demonstrate that common models describing folding for many proteins work well for cytochrome c when heme is explicitly introduced, generally providing results that agree with experimental observations. In this Account, we first discuss results from simple native structure-based models. These models include attractive interactions between nonadjacent residues only if they are present in the crystal structure at pH 7. Because attractive nonnative contacts are not included in native structure-based models, their energy landscapes can be described as "perfectly funneled". In other words, native structure-based models are energetically guided towards the native state and contain no energetic traps that would hinder folding. Energetic traps are denoted sources of "frustration", which cause specific transient intermediates to be populated. Native structure-based models do, however, include repulsion between residues due to excluded volume. Nonenergetic traps can therefore exist if the chain, which cannot cross over itself, must partially unfold so that folding can proceed. The ability of native structure-based models to capture this kind of motion is partly responsible for their successful predictions of folding pathways for many types of proteins. Models without frustration describe the sequence of folding events for cytochrome c well (as inferred from hydrogen-exchange experiments), thereby justifying their use as a starting point. At low pH, the experimentally observed folding sequence of cytochrome c deviates from that at pH 7 and from models with perfectly funneled energy landscapes. Here, alternate folding pathways are a result of "chemical frustration". This frustration arises because some regions of the protein are destabilized more than others due to the heterogeneous distribution of titratable residues that are protonated at low pH. Beginning with native structure-based terms, we construct more complex models by adding chemical frustration. These more complex models only modestly perturb the energy landscape, which remains, overall, well funneled. These perturbed models can accurately describe how alternative folding pathways are used at low pH. At alkaline pH, cytochrome c populates distinctly different structural ensembles. For instance, lysine residues are deprotonated and compete for the heme ligation site. The same models that can describe folding at low pH also predict well the structures and relative stabilities of intermediates populated at alkaline pH. The success of models based on funneled energy landscapes suggest that cytochrome c folding is driven primarily by native contacts. The presence of heme appears to add chemical complexity to the folding process, but it does not require fundamental modification of the general principles used to describe folding. Moreover, its added complexity provides a valuable means of probing the folding energy landscape in greater detail than is possible with simpler systems.
Figures


Similar articles
-
Chemical frustration in the protein folding landscape: grand canonical ensemble simulations of cytochrome c.Biochemistry. 2009 Mar 24;48(11):2394-402. doi: 10.1021/bi802293m. Biochemistry. 2009. PMID: 19199810 Free PMC article.
-
A funneled energy landscape for cytochrome c directly predicts the sequential folding route inferred from hydrogen exchange experiments.Proc Natl Acad Sci U S A. 2005 Aug 30;102(35):12401-6. doi: 10.1073/pnas.0505274102. Epub 2005 Aug 22. Proc Natl Acad Sci U S A. 2005. PMID: 16116080 Free PMC article.
-
Kinetics and motional dynamics of spin-labeled yeast iso-1-cytochrome c: 1. Stopped-flow electron paramagnetic resonance as a probe for protein folding/unfolding of the C-terminal helix spin-labeled at cysteine 102.Biochemistry. 1997 Mar 11;36(10):2884-97. doi: 10.1021/bi962155i. Biochemistry. 1997. PMID: 9062118
-
Fuzziness and Frustration in the Energy Landscape of Protein Folding, Function, and Assembly.Acc Chem Res. 2021 Mar 2;54(5):1251-1259. doi: 10.1021/acs.accounts.0c00813. Epub 2021 Feb 8. Acc Chem Res. 2021. PMID: 33550810 Free PMC article. Review.
-
Early events, kinetic intermediates and the mechanism of protein folding in cytochrome C.Int J Mol Sci. 2009 Apr 1;10(4):1476-1499. doi: 10.3390/ijms10041476. Int J Mol Sci. 2009. PMID: 19468320 Free PMC article. Review.
Cited by
-
Frustration in biomolecules.Q Rev Biophys. 2014 Nov;47(4):285-363. doi: 10.1017/S0033583514000092. Epub 2014 Sep 16. Q Rev Biophys. 2014. PMID: 25225856 Free PMC article. Review.
-
Reassessing the exon-foldon correspondence using frustration analysis.Proc Natl Acad Sci U S A. 2024 Jul 9;121(28):e2400151121. doi: 10.1073/pnas.2400151121. Epub 2024 Jul 2. Proc Natl Acad Sci U S A. 2024. PMID: 38954548 Free PMC article.
-
Cardiolipin signaling mechanisms: collapse of asymmetry and oxidation.Antioxid Redox Signal. 2015 Jun 20;22(18):1667-80. doi: 10.1089/ars.2014.6219. Epub 2015 Mar 31. Antioxid Redox Signal. 2015. PMID: 25566681 Free PMC article. Review.
-
Mapping polymerization and allostery of hemoglobin S using point mutations.J Phys Chem B. 2013 Oct 24;117(42):13058-68. doi: 10.1021/jp4025156. Epub 2013 Sep 9. J Phys Chem B. 2013. PMID: 23957820 Free PMC article.
-
Microsecond barrier-limited chain collapse observed by time-resolved FRET and SAXS.J Mol Biol. 2014 May 1;426(9):1980-94. doi: 10.1016/j.jmb.2014.02.020. Epub 2014 Mar 4. J Mol Biol. 2014. PMID: 24607691 Free PMC article.
References
-
- Sosnick TR, Mayne L, Englander SW. Molecular collapse: The rate-limiting step in two-state cytochrome c folding. Proteins-Structure Function and Genetics. 1996;24:413–426. - PubMed
-
- Babul J, ES Participation of protein ligands in folding of cytochrome c. Biochemistry. 1972;11:1195. - PubMed
-
- Privalov P, Tsalkova T. Micro-stabilities and macro-stabilities of globular-proteins. Nature. 1979;280:693–696. - PubMed
-
- Northrup S, Pear M, Mccammon J, Karplus M, Takano T. Internal mobility of ferrocytochrome-c. Nature. 1980;287:659–660. - PubMed
Publication types
MeSH terms
Substances
Grants and funding
LinkOut - more resources
Full Text Sources
