. 2010 Mar 1;82(5):1766-78.
doi: 10.1021/ac902361f.

A statistically rigorous test for the identification of parent-fragment pairs in LC-MS datasets

Affiliations
Free PMC article

A statistically rigorous test for the identification of parent-fragment pairs in LC-MS datasets

Andreas Ipsen et al. Anal Chem. .
Free PMC article

Abstract

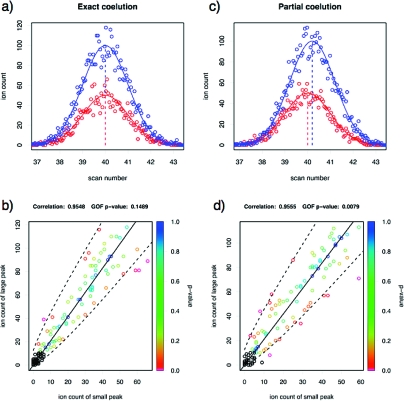
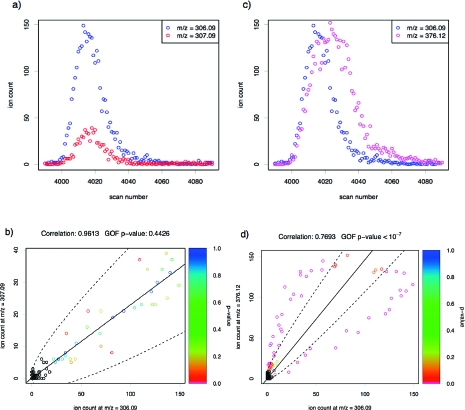
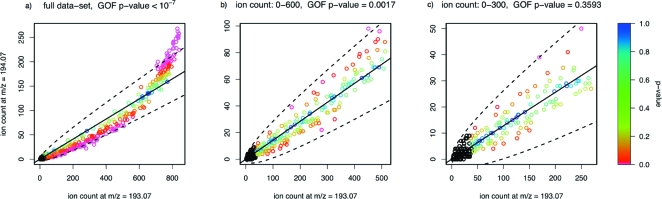
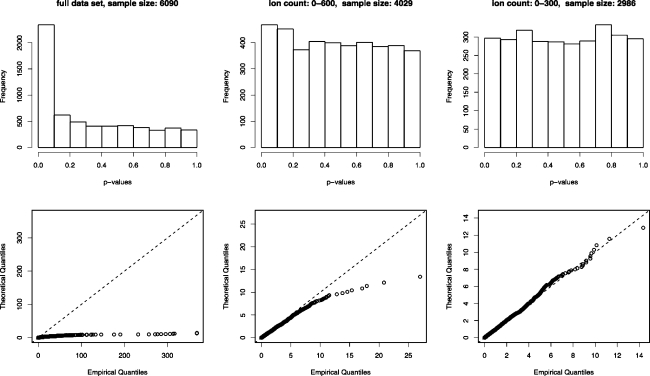
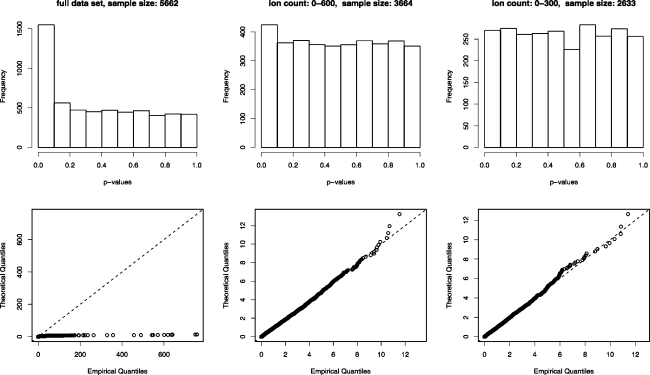
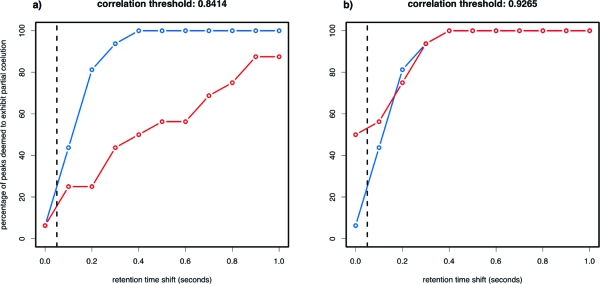
Untargeted global metabolic profiling by liquid chromatography-mass spectrometry generates numerous signals that are due to unknown compounds and whose identification forms an important challenge. The analysis of metabolite fragmentation patterns, following collision-induced dissociation, provides a valuable tool for identification, but can be severely impeded by close chromatographic coelution of distinct metabolites. We propose a new algorithm for identifying related parent-fragment pairs and for distinguishing these from signals due to unrelated compounds. Unlike existing methods, our approach addresses the problem by means of a hypothesis test that is based on the distribution of the recorded ion counts, and thereby provides a statistically rigorous measure of the uncertainty involved in the classification problem. Because of technological constraints, the test is of primary use at low and intermediate ion counts, above which detector saturation causes substantial bias to the recorded ion count. The validity of the test is demonstrated through its application to pairs of coeluting isotopologues and to known parent-fragment pairs, which results in test statistics consistent with the null distribution. The performance of the test is compared with a commonly used Pearson correlation approach and found to be considerably better (e.g., false positive rate of 6.25%, compared with a value of 50% for the correlation for perfectly coeluting ions). Because the algorithm may be used for the analysis of high-mass compounds in addition to metabolic data, we expect it to facilitate the analysis of fragmentation patterns for a wide range of analytical problems.


Figures

Figure 1
Figure 1
(Top) Two simulated chromatographic peaks exhibiting exact coelution (a) and two simulated chromatographic peaks exhibiting very close but partial coelution (c), as indicated by the shifted means (10% of the standard deviation of the peaks). (Bottom) The corresponding scatterplots with the p-values of the x2-statistics of each data-point indicated by color-code. Low counts for which the distribution of the x2-statistics may deviate substantially from the χ12-distribution are excluded, and these data points are indicated in black. While the correlations are approximately the same in either scenario, the p-value of the pooled X2-statistic is highly significant under partial coelution (p = 0.0079), but quite moderate under exact coelution (p = 0.1489).
Figure 2
Figure 2
Similar to Figure 1, except, in this case, real LC-MS data derived from synthetic urine are used. The left-hand side shows the chromatographic peaks (a) and scatterplot (b) of a pair of isotopologues, which, like related fragments, may be expected to exhibit exact coelution; the right-hand side shows the chromatographic peaks (c) and scatterplot (d) of two presumably unrelated compounds. The difference in the estimated means is 6.34 times the estimated standard deviation.
Figure 3
Figure 3
Continuum plots of a pair of isotopologues. The x-axis indicates the chromatographic scan number, while the y-axis indicates each of the individual “ticks” of the clock that measures the time-of-flight of the ions, along with the corresponding m/z values. The number of ions counted at each tick is indicated by the color code. In these two cases, there are no apparent signs of interference from other compounds of similar masses.
Figure 4
Figure 4
Scatterplots for the three datasets derived from 4-aminohippuric acid: (a) the full data set, (b) the dataset with low and moderate counts, and (c) the dataset with only low counts. The approximate p-values of the x2-statistics are indicated by color code, and the p-values of the pooled X2-statistics are listed.
Figure 5
Figure 5
(Top) Histograms of the p-values corresponding to the x2-statistics derived from the three datasets and (bottom) quantile−quantile plots of the x2-statistics themselves, compared to the theoretical χ12-distribution. Only the dataset of low counts seems to closely approximate the χ12-distribution.
Figure 6
Figure 6
(Top) Histograms of the p-values corresponding to the x2-statistics derived from the three datasets after they had been corrected for detector saturation and (bottom) quantile−quantile plots of the x2 statistics themselves, compared to the theoretical χ12-distribution. Only for the dataset of low and moderate counts does the correction seem to cause the distribution of the x2-statistics to be substantially closer to the χ12-distribution than it was for the raw data, although some deviations remain.
Figure 7
Figure 7
Ion counts of 4-aminohippuric acid (blue), the fragment formed by the loss of carbon dioxide (black), and a partially coeluting compound (red) used in the ionization suppression test. If the rate functions of 4-aminohippuric acid and its fragment were reduced by significantly differing factors by the partially coeluting compound, we would expect their ratio to start shifting near scan number 1680, but no such effect is observed.
Figure 8
Figure 8
Histogram of the p-values returned by the GOF test when applied to the low ion counts of the six parent−fragment pairs (left), and quantile−quantile plot of the corresponding x2-statistics (right). The results are consistent with those obtained for the isotopologues, and there is no evidence that the coelution of distinct compounds affects the validity of the GOF test.
Figure 9
Figure 9
Plots of the percentage of the isotopologue pairs that are classified as exhibiting partial coelution by the GOF test (blue) and the correlation (red), as a function of “increasingly partial” coelution. Only the leftmost point corresponds to exactly coeluting peaks and thereby indicates the false-positive rate. False-negative rates correspond to 100 minus the ordinate for nonzero retention time shifts. Plot (a) standardizes the two tests by matching their false positive rates, while plot (b) matches their false negative rates. Clearly, the performance of the GOF test is considerably better than that of the correlation.

Similar articles

Cited by

References

    1. Raamsdonk L. M.; Teusink B.; Broadhurst D.; Zhang N. S.; Hayes A.; Walsh M. C.; Berden J. A.; Brindle K. M.; Kell D. B.; Rowland J. J.; Westerhoff H. V.; van Dam K.; Oliver S. G. Nat. Biotechnol. 2001, 19, 45–50. - PubMed
    1. Nicholson J. K.; Lindon J. C.; Holmes E. Xenobiotica 1999, 29 (11), 1181–1189. - PubMed
    1. Metz T. O.; Zhang O.; Page J. S.; Shen Y.; Callister S. J.; Jacobs J. M.; Smith R. D. Biomark. Med. 2007, 1 (1), 159–185. - PMC - PubMed
    1. Want E. J.; Nordstrom A.; Morita H.; Siuzdak G. J. Proteome Res. 2007, 6, 459–468. - PubMed
    1. Griffiths W.; Jonsson A. P.; Liu S.; Rai D. K.; Wang Y. J. Biochem. 2001, 355, 545–561. - PMC - PubMed

Publication types

MeSH terms