

Defining the humoral immune response to infectious agents using high-density protein microarrays
- PMID: 20143947
- PMCID: PMC2841399
- DOI: 10.2217/fmb.09.127
Defining the humoral immune response to infectious agents using high-density protein microarrays
Abstract
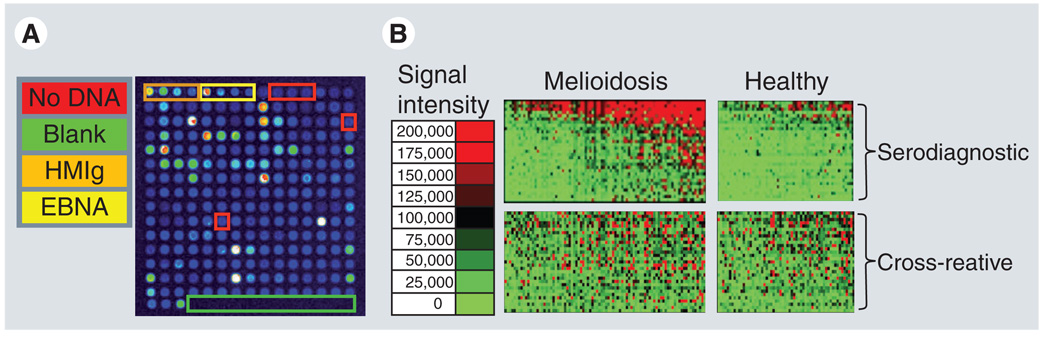
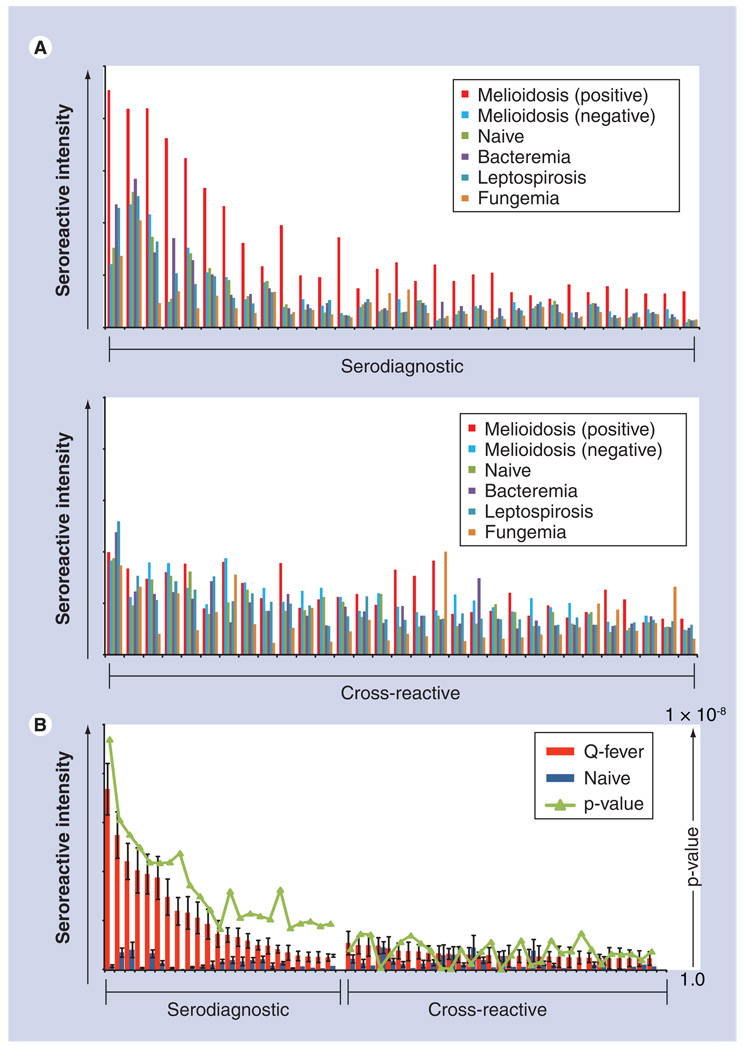
A major component of the adaptive immune response to infection is the generation of protective and long-lasting humoral immunity. Traditional approaches to understanding the host's humoral immune response are unable to provide an integrated understanding of the antibody repertoire generated in response to infection. By studying multiple antigenic responses in parallel, we can learn more about the breadth and dynamics of the antibody response to infection. Measurement of antibody production following vaccination is also a gauge for efficacy, as generation of antibodies can protect from future infections and limit disease. Protein microarrays are well suited to identify, quantify and compare individual antigenic responses following exposure to infectious agents. This technology can be applied to the development of improved serodiagnostic tests, discovery of subunit vaccine antigen candidates, epidemiologic research and vaccine development, as well as providing novel insights into infectious disease and the immune system. In this review, we will discuss the use of protein microarrays as a powerful tool to define the humoral immune response to bacteria and viruses.
Figures
Similar articles
-
Antibody-profiling technologies for studying humoral responses to infectious agents.Expert Rev Vaccines. 2010 Jun;9(6):567-78. doi: 10.1586/erv.10.50. Expert Rev Vaccines. 2010. PMID: 20518713 Free PMC article. Review.
-
Profiling the humoral immune response of acute and chronic Q fever by protein microarray.Mol Cell Proteomics. 2011 Oct;10(10):M110.006304. doi: 10.1074/mcp.M110.006304. Epub 2011 Aug 4. Mol Cell Proteomics. 2011. PMID: 21817167 Free PMC article.
-
Immunomic approaches for antigen discovery of human parasites.Expert Rev Proteomics. 2016 Dec;13(12):1091-1101. doi: 10.1080/14789450.2016.1252675. Epub 2016 Nov 7. Expert Rev Proteomics. 2016. PMID: 27774815 Review.
-
A systems biology approach for diagnostic and vaccine antigen discovery in tropical infectious diseases.Curr Opin Infect Dis. 2015 Oct;28(5):438-45. doi: 10.1097/QCO.0000000000000193. Curr Opin Infect Dis. 2015. PMID: 26237545 Free PMC article. Review.
-
Antibody responses to viral infections: a structural perspective across three different enveloped viruses.Nat Microbiol. 2019 May;4(5):734-747. doi: 10.1038/s41564-019-0392-y. Epub 2019 Mar 18. Nat Microbiol. 2019. PMID: 30886356 Free PMC article. Review.
Cited by
-
A Protein Microarray Assay for Serological Determination of Antigen-specific Antibody Responses Following Clostridium difficile Infection.J Vis Exp. 2018 Jun 15;(136):57399. doi: 10.3791/57399. J Vis Exp. 2018. PMID: 29985307 Free PMC article.
-
Malaria vaccines: high-throughput tools for antigens discovery with potential for their development.Colomb Med (Cali). 2013 Jun 30;44(2):121-8. eCollection 2013 Apr. Colomb Med (Cali). 2013. PMID: 24892459 Free PMC article. Review.
-
Identification of the feline humoral immune response to Bartonella henselae infection by protein microarray.PLoS One. 2010 Jul 6;5(7):e11447. doi: 10.1371/journal.pone.0011447. PLoS One. 2010. PMID: 20625509 Free PMC article.
-
Identification of a common immune signature in murine and human systemic Salmonellosis.Proc Natl Acad Sci U S A. 2012 Mar 27;109(13):4998-5003. doi: 10.1073/pnas.1111413109. Epub 2012 Feb 13. Proc Natl Acad Sci U S A. 2012. PMID: 22331879 Free PMC article.
-
Use of principal components analysis and protein microarray to explore the association of HIV-1-specific IgG responses with disease progression.AIDS Res Hum Retroviruses. 2014 Jan;30(1):37-44. doi: 10.1089/AID.2013.0088. Epub 2013 Dec 9. AIDS Res Hum Retroviruses. 2014. PMID: 24134221 Free PMC article. Clinical Trial.
References
-
- MacBeath G, Schreiber SL. Printing proteins as microarrays for high-throughput function determination. Science. 2000;289(5485):1760–1763. - PubMed
-
- Emili AQ, Cagney G. Large-scale functional analysis using peptide or protein arrays. Nat. Biotechnol. 2000;18(4):393–397. - PubMed
-
- Samanich KM, Belisle JT, Sonnenberg MG, Keen MA, Zolla-Pazner S, Laal S. Delineation of human antibody responses to culture filtrate antigens of Mycobacterium tuberculosis. J. Infect. Dis. 1998;178(5):1534–1538. - PubMed
Publication types
MeSH terms
Substances
Grants and funding
LinkOut - more resources
Full Text Sources
Other Literature Sources