

Spatial variability of climate effects on ischemic heart disease hospitalization rates for the period 1989-2006 in Quebec, Canada
- PMID: 20144187
- PMCID: PMC2830188
- DOI: 10.1186/1476-072X-9-5
Spatial variability of climate effects on ischemic heart disease hospitalization rates for the period 1989-2006 in Quebec, Canada
Abstract
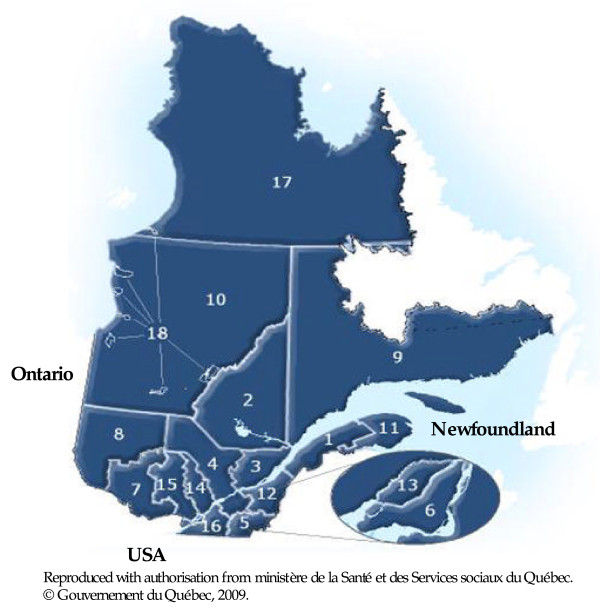
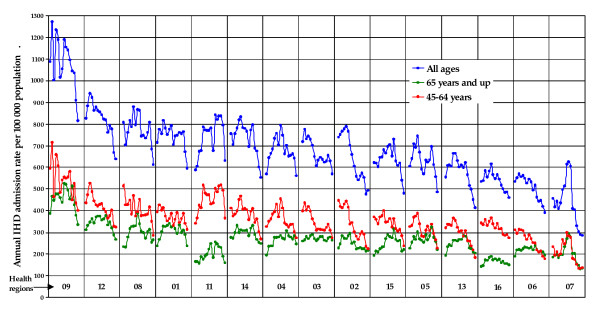
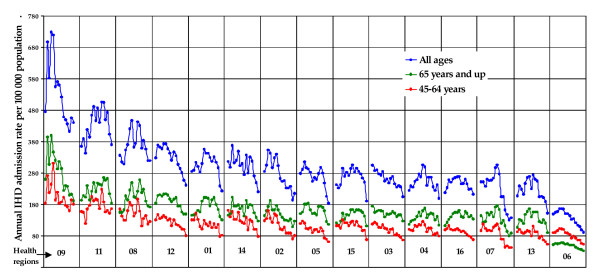
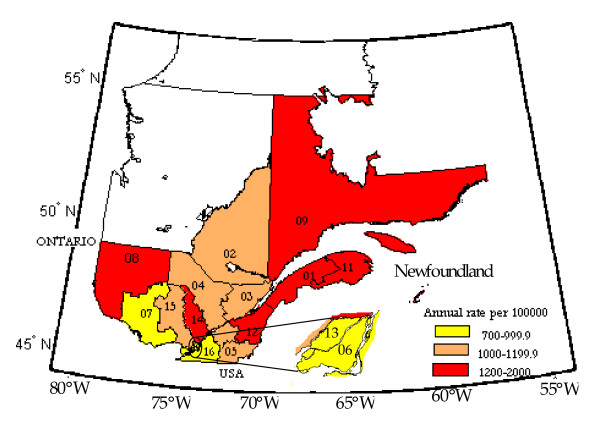
Background: Studies have suggested an association between climate variables and circulatory diseases. The short-term effect of climate conditions on the incidence of ischemic heart disease (IHD) over the 1989-2006 period was examined for Quebec's 18 health regions.
Methods: Analyses were carried out for two age groups. A GAM statistical model, that blends the properties of generalized linear models with additive models, was used to fit the standardized daily hospitalization rates for IHD and their relationship with climatic conditions up to two weeks prior to the day of admission, controlling for time trends, day of the season and gender.
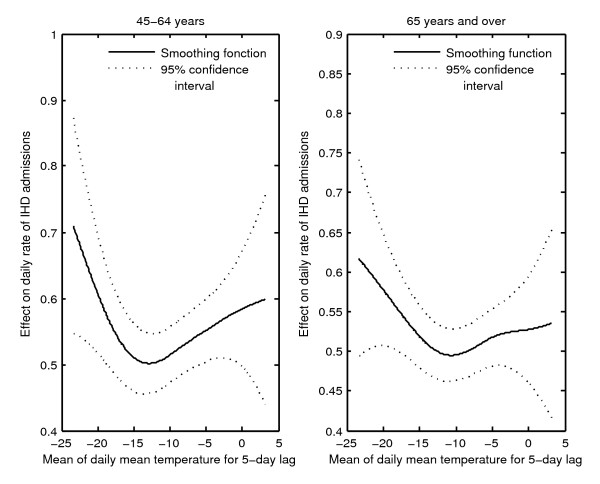
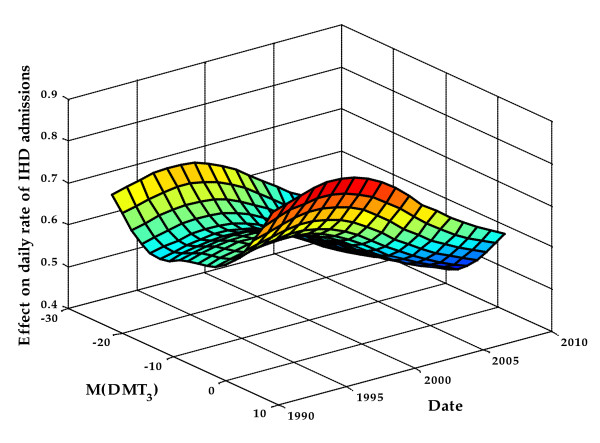
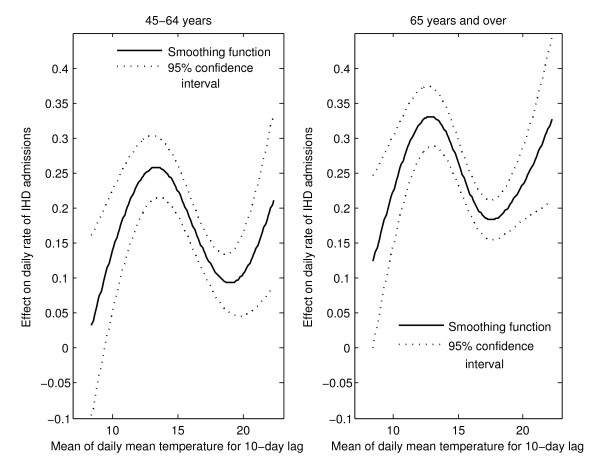
Results: Results show that, in most of Quebec's regions, cold temperatures during winter months and hot episodes during the summer months are associated with an increase of up to 12% in the daily hospital admission rate for IHD but also show decreased risks in some areas. The risk of hospitalization is higher for men and women of 45-64 years and varies spatially. In most regions, exposure to a continuous period of cold or hot temperature was more harmful than just one isolated day of extreme weather. Men aged 45-64 years showed higher risk levels of IHD than women of the same age group. In most regions, the annual maximum of daily IHD admissions for 65 years old was reached earlier in the season for both genders and both seasons compared to younger age groups. The effects of meteorological variables on the daily IHD admissions rate were more pronounced in regions with high smoking prevalence and high deprivation index.
Conclusion: This study highlights the differential effects of cold and hot periods on IHD in Quebec health regions depending on age, sex, and other factors such as smoking, behaviour and deprivation levels.
Figures
References
-
- Lee DS, Chiu M, Manuel DG, Tu K, Wang X, Austin PC, Mattern MY, Mitiku TF, Svenson LW, Putnam W, Flanagan WM, Tu JV. Canadian Cardiovascular Outcomes Research Team. Trends in risk factors for cardiovascular disease in Canada: temporal, socio-demographic and geographic factors. CMAJ. 2009;181:E55–66. - PMC - PubMed
-
- Dai S, Bancej C, Bienek A, Walsh P, Stewart P, Weilgosz A. Tracking heart disease and stroke in Canada 2009. Chronic Dis Can. 2009;29:192–193.
-
- Saez M, Sunyer J, Tobias A, Ballester S, Antó JM. Ischemic heart disease mortality and weather temperature in Barcelona, Spain. Eur J Public Health. 2000;10:58–63. doi: 10.1093/eurpub/10.1.58. - DOI
Publication types
MeSH terms
LinkOut - more resources
Full Text Sources
