. 2010 Feb 8:11:79.
doi: 10.1186/1471-2105-11-79.

Using simple artificial intelligence methods for predicting amyloidogenesis in antibodies

Affiliations

Using simple artificial intelligence methods for predicting amyloidogenesis in antibodies

Maria Pamela C David et al. BMC Bioinformatics. .

Abstract

Background: All polypeptide backbones have the potential to form amyloid fibrils, which are associated with a number of degenerative disorders. However, the likelihood that amyloidosis would actually occur under physiological conditions depends largely on the amino acid composition of a protein. We explore using a naive Bayesian classifier and a weighted decision tree for predicting the amyloidogenicity of immunoglobulin sequences.

Results: The average accuracy based on leave-one-out (LOO) cross validation of a Bayesian classifier generated from 143 amyloidogenic sequences is 60.84%. This is consistent with the average accuracy of 61.15% for a holdout test set comprised of 103 AM and 28 non-amyloidogenic sequences. The LOO cross validation accuracy increases to 81.08% when the training set is augmented by the holdout test set. In comparison, the average classification accuracy for the holdout test set obtained using a decision tree is 78.64%. Non-amyloidogenic sequences are predicted with average LOO cross validation accuracies between 74.05% and 77.24% using the Bayesian classifier, depending on the training set size. The accuracy for the holdout test set was 89%. For the decision tree, the non-amyloidogenic prediction accuracy is 75.00%.

Conclusions: This exploratory study indicates that both classification methods may be promising in providing straightforward predictions on the amyloidogenicity of a sequence. Nevertheless, the number of available sequences that satisfy the premises of this study are limited, and are consequently smaller than the ideal training set size. Increasing the size of the training set clearly increases the accuracy, and the expansion of the training set to include not only more derivatives, but more alignments, would make the method more sound. The accuracy of the classifiers may also be improved when additional factors, such as structural and physico-chemical data, are considered. The development of this type of classifier has significant applications in evaluating engineered antibodies, and may be adapted for evaluating engineered proteins in general.


Figures
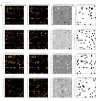
Figure 1
Figure 1
Normalized mutation matrices of amyloidogenic (Column A) and non-amyloidogenic derivatives (Column B) of 12 antibody germlines. Original residues are in rows and corresponding replacement residues are in columns. The amino acids have been arranged according to increasing β-sheet forming propensities [54]. The intensity matrix of the difference between the amyloidogenic and non-amyloidogenic matrices (Column C) reflects the relative predominance of a mutation type in either amyloid or non-amyloid formers. A fourth matrix set (Column D) is used to indicate the mutations that occur exclusively in amyloidogenic derivatives. Separate matrices were generated for mutations in buried CDR, exposed CDR, buried FR and exposed FR positions.
Figure 2
Figure 2
Analysis of mutations exclusive to amyloidogenic derivatives. A rough analysis of mutation patterns could be made by dividing the matrix using the diagonal, or by dividing it into quadrants. Mutations to the right of the diagonal are characterized by increased sheet-forming propensities (+), while those to the left imply the opposite (-). In terms of the quadrants, which are numbered in the same way as the Cartesian plane, the first contains information on mutations from low- to mid-propensity, sheet-associated amino acids to relatively high-propensity sheet-associated amino acids (++), while the third quadrant contains the opposite (--). In the most general sense, mutations either on the right of the diagonal, or in the first and third quadrants (shaded), would be the biggest contributors to destabilization. The analysis indicates that a significant number of mutations in the exposed CDR residues result in increased β-sheet-forming propensities, while mutations in buried FR residues tend to be associated with a decrease in β-sheet-forming propensities.
Figure 3
Figure 3
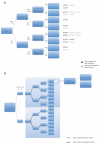
Decision tree for the evaluation of individual mutations. A decision tree (A) was constructed in order to evaluate the contribution of a mutation to amyloidogenicity. A path is followed for each mutation, depending on its position and exposure, as well as on the increase or decrease in sheet-forming propensity associated with it. Each path leads to one of eight terminal nodes, which is associated with a score, defined as the product of the weights (in italics) along the path leading to it. An analysis of paths taken by amyloidogenic and non-amyloidogenic derivatives of the different germlines indicated that different pairs of terminal nodes may be used to provide maximum separation between these derivatives. For instance, amyloidogenic derivatives of X93627 mostly end in leaf 1, while the non-amyloidogenic counterparts are more frequently associated with leaf 7; germline derivatives that can be distinguished using specific terminal nodes are indicated in the illustration. Based on this analysis, a final tree (B) was created which branches first on the basis of the germline to which the derivative being tested belongs; the structure and weights of the original tree (A) are kept. Each edge emanating from a germline node is connected to a copy of the original tree, where weights on paths which could be used for maximizing the separation between amyloidogenic and non-amyloidogenic derivatives are either boosted or decreased tenfold. For the illustrative example in (B), paths for J00248 (Germline 1) and Z22208 (Germline n) are shown.
Figure 4
Figure 4
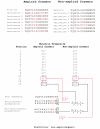
Application of the naive Bayesian method for the prediction of amyloidosis. Given a set of amyloidogenic and non-amyloidogenic derivatives of a single germline, it is possible to generate the probability that a mutation at a particular position would cause amyloidosis or not. Briefly, separate mutation propensities for amyloid (pAM) and non-amyloid (pNAM) formers are generated by counting the frequency of mutations per position. These fractions, as well as complements thereof (i.e. the probability that there will be no mutation in either an amyloid-former or non-amyloid-former at a particular position, in black) are subsequently used to compute the amyloidogenic and non-amyloidogenic probabilities of a test sequence. To calculate for the amyloidogenic probability of a test sequence, a probability is assigned to each of the n positions in the sequence based on the characteristic of that position (i.e. if it contains a mutation or not). For positions containing no mutations this probability is equivalent to qAM, qAM = 1 - pAM for position x. The probability for positions with mutations is equal to pAM . Non-amyloidogenic probabilities are calculated in a similar manner, but with the use of pNAM instead of pAM . To avoid multiplications by zero, the Laplace correction is used. A product of the probabilities is subsequently taken; if the product of amylodogenic probabilities is higher, the test sequence is classified as amyloidogenic.
Figure 5
Figure 5
Steps in generating and testing a weighted decision tree. To create a weighted decision tree, mutations from amyloidogenic and non-amyloidogenic derivatives of a single germline are organized into separate matrices that factor in location, exposure and sheet-forming propensity into account (Step 1). These matrices are visualized and analyzed for general trends that may be transformed into weights (Step 2). An initial tree is constructed from these information, which is tested against the training set (Step 3). From this testing, it became evident that certain paths can be used for maximally separating amyloidogenic and non-amyloidogenic derivatives of a germline, and that these paths are germline-dependent. We then generated a tree that takes the germline of origin into account, and which has different boosted paths. The final step was to generate the classification threshold, which was determined from the analysis of scores for the test set (Step 4). This tree was then used to classify sequences in an independent, holdout test set (Step 5).

Similar articles

Cited by

References

    1. Presta L. Antibody engineering. Curr Opin Biotechnol. 1992;3:394–398. doi: 10.1016/0958-1669(92)90168-I. - DOI - PubMed
    1. Presta L. Antibody engineering for therapeutics. Current Opinion in Structural Biology. 2003;13(4):519–525. doi: 10.1016/S0959-440X(03)00103-9. - DOI - PubMed
    1. Padlan E. A possible procedure for reducing the immunogenicity of antibody variable domains while preserving their ligand-binding properties. Molecular Immunology. 1991;28(4-5):489–498. doi: 10.1016/0161-5890(91)90163-E. - DOI - PubMed
    1. Roguska M, Pedersen J, Keddy C. Humanization of murine monoclonal antibodies through variable domain resurfacing. Proceedings of the National Academy of Sciences. 1994;91:969–973. doi: 10.1073/pnas.91.3.969. - DOI - PMC - PubMed
    1. Clark M. Antibody humanization: a case of the 'Emperor's new clothes'? Immunol Today. 2000;21:397–402. doi: 10.1016/S0167-5699(00)01680-7. - DOI - PubMed

LinkOut - more resources