. 2010 Feb 9:11:80.
doi: 10.1186/1471-2105-11-80.

Parameters for accurate genome alignment

Affiliations

Parameters for accurate genome alignment

Martin C Frith et al. BMC Bioinformatics. .

Abstract

Background: Genome sequence alignments form the basis of much research. Genome alignment depends on various mundane but critical choices, such as how to mask repeats and which score parameters to use. Surprisingly, there has been no large-scale assessment of these choices using real genomic data. Moreover, rigorous procedures to control the rate of spurious alignment have not been employed.

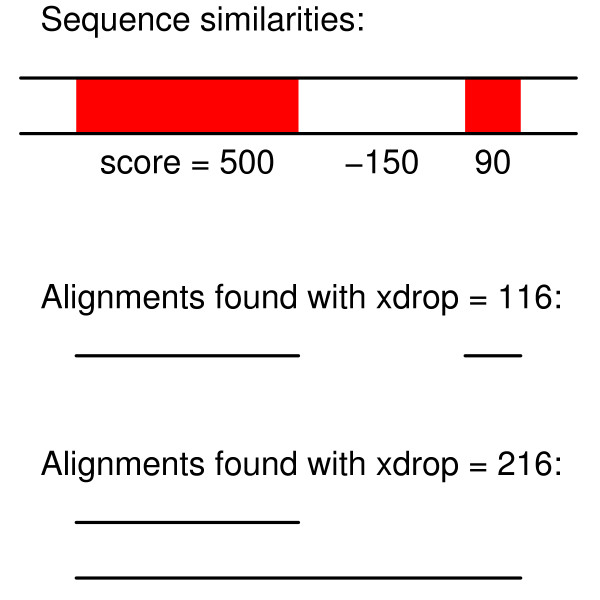
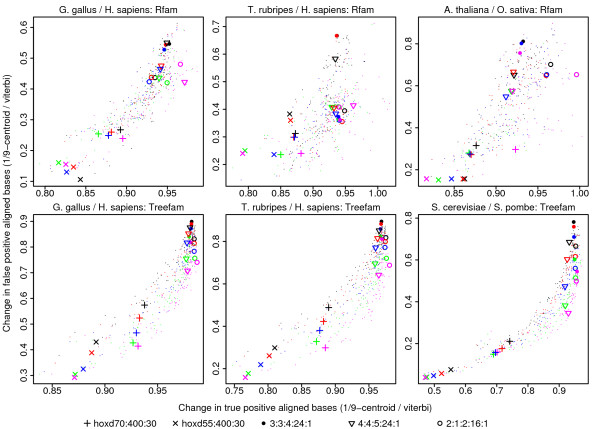
Results: We have assessed 495 combinations of score parameters for alignment of animal, plant, and fungal genomes. As our gold-standard of accuracy, we used genome alignments implied by multiple alignments of proteins and of structural RNAs. We found the HOXD scoring schemes underlying alignments in the UCSC genome database to be far from optimal, and suggest better parameters. Higher values of the X-drop parameter are not always better. E-values accurately indicate the rate of spurious alignment, but only if tandem repeats are masked in a non-standard way. Finally, we show that gamma-centroid (probabilistic) alignment can find highly reliable subsets of aligned bases.

Conclusions: These results enable more accurate genome alignment, with reliability measures for local alignments and for individual aligned bases. This study was made possible by our new software, LAST, which can align vertebrate genomes in a few hours http://last.cbrc.jp/.


Figures

Figure 1
Figure 1
E-values of reverse genome alignments with six repeat-masking methods. In each column, the second-named genome was reversed and then aligned to the first-named genome twenty times, using twenty different scoring schemes. The red lines show the theoretically expected number of alignments at each E-value threshold, and the black lines show the observed number. Alignments in rows 1-5 and 7 were performed with LAST, and those in row 6 were done with BLASTZ, using BLASTZ's internal entropy-masking method. "TRFs": Tandem Repeats Finder with standard parameters; "TRF": Tandem Repeats Finder with non-standard parameters; "hard": hard-masking; "soft": soft-masking.
Figure 2
Figure 2
A spurious similarity caused by tandem repeats. The upper sequence is from the C. elegans genome and the lower sequence is from the reversed C. brenneri genome. DustMasker fails to mask these sequences.
Figure 3
Figure 3
Spurious alignment quantities compared to total alignment quantities, with soft repeat-masking. The horizontal axis of each graph represents an E-value threshold and the vertical axis represents the number of alignments (first row) exceeding that threshold, and the number of aligned bases contained in those alignments (second row). In each column, the second-named genome was reversed (black lines) or not (blue lines), and then aligned to the first-named genome using twenty different scoring schemes. The red lines show the theoretically expected number of alignments at each E-value threshold. Repeat-masking was done with WindowMasker, including its DustMasker component.
Figure 4
Figure 4
Genome alignment accuracies with 495 combinations of score parameters. Each point represents one genome alignment with one combination of score parameters. A few of these are highlighted with symbols: see the key beneath the figure. True positives (horizontal axis) and false positives (vertical axis) were counted with reference to either Rfam (upper row) or TreeFam (lower row). Colors indicate the X-drop parameter. For black points: the X-drop parameter was set to allow a maximum gap size of 20; red: 30; blue: 50; green: 100 and magenta: 200. The same results, but with different scoring schemes highlighted, are shown in Additional file 1, Figure S2.
Figure 5
Figure 5
Genome alignment accuracies using BLASTZ. This is the same as the lower right panel in Figure 4, except that here the alignments were done with BLASTZ instead of LAST.
Figure 6
Figure 6
A problem with large X-drop values. This sketch represents two similar regions with positive alignment scores (red) separated by a dissimilar region with a negative alignment score. For low X-drop values, the two similar regions are found as separate alignments. For high X-drop values, the X-drop algorithm crosses the dissimilar region: so the alignment seeded from the right-hand similarity has sub-optimal score. In this case, LAST would only report the one alignment with score = 500.
Figure 7
Figure 7
Genome alignment accuracies for 1/9-centroid alignment compared to ordinary (Viterbi) alignment. Each point represents one combination of score parameters. A few of these are highlighted with symbols: see the key beneath the figure. Colors indicate the X-drop parameter as in Figure 4. The X-coordinate indicates the number of true positives for 1/9-centroid alignment as a fraction of the number of true positives for Viterbi alignment. Likewise for the Y-coordinate and false positives. The 1/9-centroid results alone, without comparison to Viterbi alignment, are shown in Additional file 1, Figure S9.

Similar articles

Cited by

References

    1. Stark A, Lin MF, Kheradpour P, Pedersen JS, Parts L, Carlson JW, Crosby MA, Rasmussen MD, Roy S, Deoras AN. Discovery of functional elements in 12 Drosophila genomes using evolutionary signatures. Nature. 2007;450:219–232. doi: 10.1038/nature06340. - DOI - PMC - PubMed
    1. Yuh CH, Brown CT, Livi CB, Rowen L, Clarke PJ, Davidson EH. Patchy interspecific sequence similarities efficiently identify positive cis-regulatory elements in the sea urchin. Dev Biol. 2002;246:148–161. doi: 10.1006/dbio.2002.0618. - DOI - PubMed
    1. Friedman RC, Farh KK, Burge CB, Bartel DP. Most mammalian mRNAs are conserved targets of microRNAs. Genome Res. 2009;19:92–105. doi: 10.1101/gr.082701.108. - DOI - PMC - PubMed
    1. Janecka JE, Miller W, Pringle TH, Wiens F, Zitzmann A, Helgen KM, Springer MS, Murphy WJ. Molecular and genomic data identify the closest living relative of primates. Science. 2007;318:792–794. doi: 10.1126/science.1147555. - DOI - PubMed
    1. Treangen TJ, Messeguer X. M-GCAT: interactively and efficiently constructing large-scale multiple genome comparison frameworks in closely related species. BMC Bioinformatics. 2006;7:433. doi: 10.1186/1471-2105-7-433. - DOI - PMC - PubMed

Publication types