. 2010 Feb 9:8:13.
doi: 10.1186/1741-7007-8-13.

Stone formation in peach fruit exhibits spatial coordination of the lignin and flavonoid pathways and similarity to Arabidopsis dehiscence

Affiliations

Stone formation in peach fruit exhibits spatial coordination of the lignin and flavonoid pathways and similarity to Arabidopsis dehiscence

Christopher D Dardick et al. BMC Biol. .

Abstract

Background: Lignification of the fruit endocarp layer occurs in many angiosperms and plays a critical role in seed protection and dispersal. This process has been extensively studied with relationship to pod shatter or dehiscence in Arabidopsis. Dehiscence is controlled by a set of transcription factors that define the fruit tissue layers and whether or not they lignify. In contrast, relatively little is known about similar processes in other plants such as stone fruits which contain an extremely hard lignified endocarp or stone surrounding a single seed.

Results: Here we show that lignin deposition in peach initiates near the blossom end within the endocarp layer and proceeds in a distinct spatial-temporal pattern. Microarray studies using a developmental series from young fruits identified a sharp and transient induction of phenylpropanoid, lignin and flavonoid pathway genes concurrent with lignification and subsequent stone hardening. Quantitative polymerase chain reaction studies revealed that specific phenylpropanoid (phenylalanine ammonia-lyase and cinnamate 4-hydroxylase) and lignin (caffeoyl-CoA O-methyltransferase, peroxidase and laccase) pathway genes were induced in the endocarp layer over a 10 day time period, while two lignin genes (p-coumarate 3-hydroxylase and cinnamoyl CoA reductase) were co-regulated with flavonoid pathway genes (chalcone synthase, dihydroflavanol 4-reductase, leucoanthocyanidin dioxygen-ase and flavanone-3-hydrosylase) which were mesocarp and exocarp specific. Analysis of other fruit development expression studies revealed that flavonoid pathway induction is conserved in the related Rosaceae species apple while lignin pathway induction is not. The transcription factor expression of peach genes homologous to known endocarp determinant genes in Arabidopsis including SHATTERPROOF, SEEDSTCK and NAC SECONDARY WALL THICENING PROMOTING FACTOR 1 were found to be specifically expressed in the endocarp while the negative regulator FRUITFUL predominated in exocarp and mesocarp.

Conclusions: Collectively, the data suggests, first, that the process of endocarp determination and differentiation in peach and Arabidopsis share common regulators and, secondly, reveals a previously unknown coordination of competing lignin and flavonoid biosynthetic pathways during early fruit development.


Figures

Figure 1
Figure 1
Progression of lignin deposition in developing peach fruit. Sectioned fruit were stained with phloroglucinol-HCl for lignin (red colour). Numbers indicate days after bloom (DAB) (A) Fruit series cut perpendicular to the fruit suture. (B) Whole fruit serially cut parallel to the suture at 45 and 51 DAB. The crosses indicate the orientation of the blossom end, the stem end and the suture.
Figure 2
Figure 2
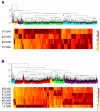
Hierarchical cluster of 907 selected genes from the μPeach1.0 microarray (A) and 2548 selected genes from the 15 K apple microarray (B). Each gene was scaled to 1 to represent maximum expression to allow cluster separation by expression pattern. The colours for each of the groupings were chosen to differentiate the groups and do not relate to the peach and apple groupings. The yellow to red scale to the right of each figure is a colour scale representing the expression level of each gene as it relates to the highest time point of expression. The intense red represents the maximum time of expression and the yellow represents the lowest per cent of that maximum expression. As the genes are different in each of the array platforms, these scales can not be compared between the platforms.
Figure 3
Figure 3
Induction of the phenylpropanoid pathway (PP), lignin and flavonoid pathways during fruit development. A heat map is shown for all significant PP, lignin and flavonoid pathway genes from the combined peach and apple microarray data. Log2-fold expression scale is shown at top. Developmental times are indicated as days after bloom along with a fruit image stained for lignin deposition. Gene abbreviations are listed along with colour coded bars indicating the corresponding pathway. A sketch of the PP, lignin and flavonoid pathways is shown on the right. Names for induced genes as determined from the array data are shown in bold.
Figure 4
Figure 4
Validation of array data using quantitative PCR (qPCR). Gene abbreviations are shown below each graph. Corresponding pathway is indicated after each abbreviation as phenylpropanoid P, lignin L or flavonoid F. Y-axis represents Log2-fold change relative to values (>0) obtained from the 87 days after bloom (DAB) reference sample. X-axis is DAB. Some of the genes were present only in the peach array, some only in the apple array (4-coumarate CoA ligase) some in both (cinnamoyl CoA reductase) and some are represented by multiple oligos (chalcone synthase). Data from the qPCR is shown as solid lines, apple array data as dotted lines and peach array data as dashed lines.
Figure 5
Figure 5
Spatial/temporal expression of eight phenylpropanoid, lignin and flavonoid pathway genes during fruit development. Gene abbreviations are indicated beneath an artificial rendering of the dissected fruit development series. Outer section represents exocarp (skin), middle section is mesocarp (flesh) and inner portion is endocarp (stone). No expression data was obtained for the seed which is represented in black. Fruit collection times are shown at top as days after bloom (DAB). Normalized relative expression values are indicated by a sliding colour scale. (A) Highest expression levels are shown in red while lowest expression values are white. (B) Actual relative expression values are graphed for each tissue section: endocarp (red), mesocarp (blue), exocarp (green). Y-axis is relative expression value based on a standard dilution curve. X-axis values are DAB.
Figure 6
Figure 6
Spatial/temporal expression of peach homologues of known dehiscence regulatory factors during fruit development. Gene abbreviations are indicated beneath an artificial rendering of the dissected fruit development series. Outer section represents exocarp (skin), middle section is mesocarp (flesh) and inner portion is endocarp (stone). No expression data was obtained for the seed which is represented in black. Fruit collection times are shown at top as days after bloom (DAB). Normalized relative expression values are indicated by a sliding colour scale. (A) Highest expression levels are shown in red while lowest expression values are white. (B) Actual relative expression values are graphed for each tissue section: endocarp (red), mesocarp (blue) and exocarp (green). Y-axis is relative expression value based on a standard dilution curve. X-axis values are DAB.

References

    1. Ryugo K. The rate of dry weight accumulation by the peach pit during the hardening process. Amer Soc Hort Sci. 1961;78:132–137.
    1. Ryugo K. Changes in methoxyl content in the peach endocarp and some of its soluble phenolic constituents during lignification. Amer Soc Hort Sci. 1963;84:110–115.
    1. Boerjan W, Ralph J, Baucher M. Lignin Biosynthesis. Annu Rev Plant Biol. 2003;54:519–546. doi: 10.1146/annurev.arplant.54.031902.134938. - DOI - PubMed
    1. Hatfield R, Vermerris W. Lignin formation in plants. The dilemma of linkage specificity. Plant Physiol. 2001;126:1351–1357. doi: 10.1104/pp.126.4.1351. - DOI - PMC - PubMed
    1. Doster MA, Michailides TJ. Relationship between shell discoloration of pistachio nuts and incidence of fungal decay and insect infestation. Plant Dis. 1999;83:259–264. doi: 10.1094/PDIS.1999.83.3.259. - DOI - PubMed

Publication types

MeSH terms