

Simulation of a Petri net-based model of the terpenoid biosynthesis pathway
- PMID: 20144236
- PMCID: PMC2838867
- DOI: 10.1186/1471-2105-11-83
Simulation of a Petri net-based model of the terpenoid biosynthesis pathway
Abstract
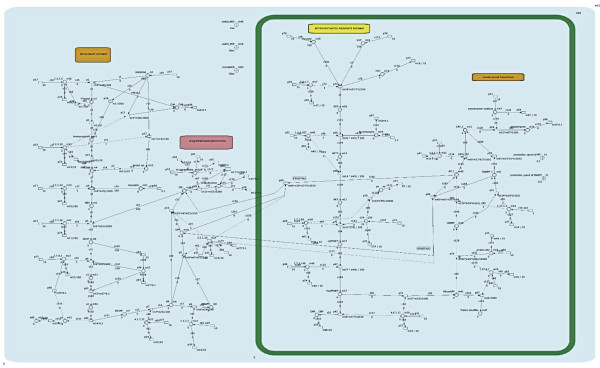
Background: The development and simulation of dynamic models of terpenoid biosynthesis has yielded a systems perspective that provides new insights into how the structure of this biochemical pathway affects compound synthesis. These insights may eventually help identify reactions that could be experimentally manipulated to amplify terpenoid production. In this study, a dynamic model of the terpenoid biosynthesis pathway was constructed based on the Hybrid Functional Petri Net (HFPN) technique. This technique is a fusion of three other extended Petri net techniques, namely Hybrid Petri Net (HPN), Dynamic Petri Net (HDN) and Functional Petri Net (FPN).
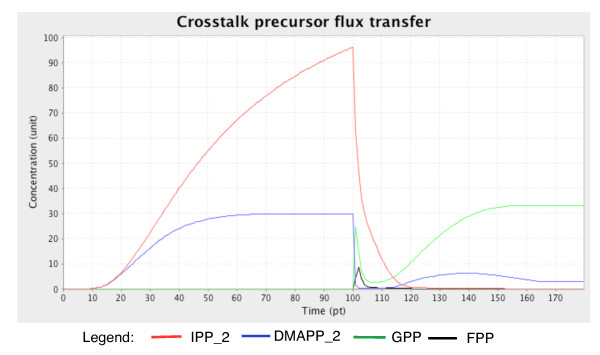
Results: The biological data needed to construct the terpenoid metabolic model were gathered from the literature and from biological databases. These data were used as building blocks to create an HFPNe model and to generate parameters that govern the global behaviour of the model. The dynamic model was simulated and validated against known experimental data obtained from extensive literature searches. The model successfully simulated metabolite concentration changes over time (pt) and the observations correlated with known data. Interactions between the intermediates that affect the production of terpenes could be observed through the introduction of inhibitors that established feedback loops within and crosstalk between the pathways.
Conclusions: Although this metabolic model is only preliminary, it will provide a platform for analysing various high-throughput data, and it should lead to a more holistic understanding of terpenoid biosynthesis.
Figures


Similar articles
-
A versatile petri net based architecture for modeling and simulation of complex biological processes.Genome Inform. 2004;15(1):180-97. Genome Inform. 2004. PMID: 15712121
-
Application of Petri net based analysis techniques to signal transduction pathways.BMC Bioinformatics. 2006 Nov 2;7:482. doi: 10.1186/1471-2105-7-482. BMC Bioinformatics. 2006. PMID: 17081284 Free PMC article.
-
Constructing biological pathway models with hybrid functional petri nets.Stud Health Technol Inform. 2011;162:92-112. Stud Health Technol Inform. 2011. PMID: 21685566
-
Discovery and Engineering of Cytochrome P450s for Terpenoid Biosynthesis.Trends Biotechnol. 2019 Jun;37(6):618-631. doi: 10.1016/j.tibtech.2018.11.008. Epub 2018 Dec 7. Trends Biotechnol. 2019. PMID: 30528904 Review.
-
Terpenoid biosynthesis off the beaten track: unconventional cyclases and their impact on biomimetic synthesis.Angew Chem Int Ed Engl. 2015 Feb 23;54(9):2604-26. doi: 10.1002/anie.201407883. Epub 2014 Dec 8. Angew Chem Int Ed Engl. 2015. PMID: 25488271 Review.
Cited by
-
Effects of the Endophytic Fungus MF23 on Dendrobium nobile Lindl. in an Artificial Primary Environment.ACS Omega. 2021 Apr 7;6(15):10047-10053. doi: 10.1021/acsomega.0c06325. eCollection 2021 Apr 20. ACS Omega. 2021. PMID: 34056160 Free PMC article.
-
A Boolean probabilistic model of metabolic adaptation to oxygen in relation to iron homeostasis and oxidative stress.BMC Syst Biol. 2011 Apr 13;5:51. doi: 10.1186/1752-0509-5-51. BMC Syst Biol. 2011. PMID: 21489274 Free PMC article.
-
An integrated pathway system modeling of Saccharomyces cerevisiae HOG pathway: a Petri net based approach.Mol Biol Rep. 2013 Feb;40(2):1103-25. doi: 10.1007/s11033-012-2153-3. Epub 2012 Oct 21. Mol Biol Rep. 2013. PMID: 23086300
References
Publication types
MeSH terms
Substances
LinkOut - more resources
Full Text Sources
Molecular Biology Databases
