

Value of self-monitoring blood glucose pattern analysis in improving diabetes outcomes
- PMID: 20144288
- PMCID: PMC2769875
- DOI: 10.1177/193229680900300314
Value of self-monitoring blood glucose pattern analysis in improving diabetes outcomes
Abstract
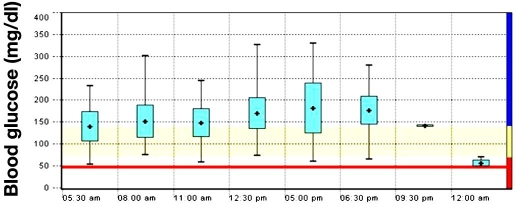
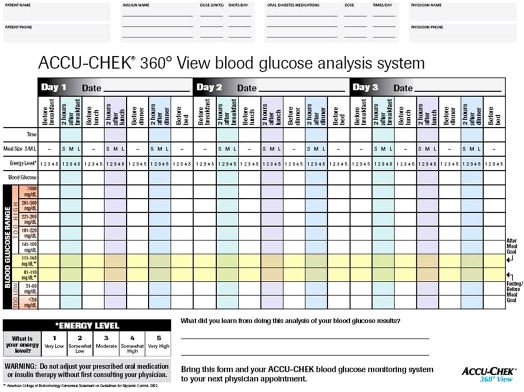
Self-monitoring of blood glucose (SMBG) is an important adjunct to hemoglobin A1c (HbA1c) testing. This action can distinguish between fasting, preprandial, and postprandial hyperglycemia; detect glycemic excursions; identify and monitor resolution of hypoglycemia; and provide immediate feedback to patients about the effect of food choices, activity, and medication on glycemic control. Pattern analysis is a systematic approach to identifying glycemic patterns within SMBG data and then taking appropriate action based upon those results. The use of pattern analysis involves: (1) establishing pre- and postprandial glucose targets; (2) obtaining data on glucose levels, carbohydrate intake, medication administration (type, dosages, timing), activity levels and physical/emotional stress; (3) analyzing data to identify patterns of glycemic excursions, assessing any influential factors, and implementing appropriate action(s); and (4) performing ongoing SMBG to assess the impact of any therapeutic changes made. Computer-based and paper-based data collection and management tools can be developed to perform pattern analysis for identifying patterns in SMBG data. This approach to interpreting SMBG data facilitates rational therapeutic adjustments in response to this information. Pattern analysis of SMBG data can be of equal or greater value than measurement of HbA1c levels.
2009 Diabetes Technology Society.
Figures
Similar articles
-
Assessing glycemic control with self-monitoring of blood glucose and hemoglobin A(1c) measurements.Mayo Clin Proc. 2007 Feb;82(2):229-35; quiz 236. doi: 10.4065/82.2.229. Mayo Clin Proc. 2007. PMID: 17290732 Review.
-
Strategies for improving glycemic control: effective use of glucose monitoring.Am J Med. 2005 Sep;118(Suppl 9A):27S-32S. doi: 10.1016/j.amjmed.2005.07.054. Am J Med. 2005. PMID: 16224940 Review.
-
Using meal-based self-monitoring blood glucose (SMBG) data to guide dietary recommendations in patients with diabetes.Diabetes Educ. 2009 Nov-Dec;35(6):1023-30. doi: 10.1177/0145721709349587. Diabetes Educ. 2009. PMID: 19934460
-
The role of self-monitoring of blood glucose during the treatment of type 2 diabetes with medications targeting postprandial hyperglycemia.South Med J. 2007 Nov;100(11):1123-31. doi: 10.1097/01.smj.0000286751.78656.45. South Med J. 2007. PMID: 17984745 Review.
-
Clinical decision making: managing postprandial hyperglycemia.J Assoc Physicians India. 2006 Nov;54:871-6. J Assoc Physicians India. 2006. PMID: 17249256 Review.
Cited by
-
Evaluation of a blood glucose monitoring system with automatic high- and low-pattern recognition software in insulin-using patients: pattern detection and patient-reported insights.J Diabetes Sci Technol. 2013 Jul 1;7(4):970-8. doi: 10.1177/193229681300700419. J Diabetes Sci Technol. 2013. PMID: 23911178 Free PMC article.
-
Frequency of Self-Monitoring of Blood Glucose during the School Day Is Associated with the Optimal Glycemic Control among Korean Adolescents with Type 1 Diabetes.Diabetes Metab J. 2018 Dec;42(6):480-487. doi: 10.4093/dmj.2018.0018. Epub 2018 Jun 29. Diabetes Metab J. 2018. PMID: 30113142 Free PMC article.
-
A Review of Emerging Technologies in Diabetes Management for Multiple-Dose Insulin-Injecting Patients With Type 2 Diabetes Who Self-monitor Blood Glucose.J Pharm Technol. 2019 Apr;35(2):69-81. doi: 10.1177/8755122518813889. Epub 2018 Nov 30. J Pharm Technol. 2019. PMID: 34861028 Free PMC article. Review.
-
Exploring differences in Canadian adult men and women with diabetes management: results from the Canadian Community Health Survey.BMC Public Health. 2013 Nov 22;13:1089. doi: 10.1186/1471-2458-13-1089. BMC Public Health. 2013. PMID: 24262007 Free PMC article.
-
A visual analytics approach for pattern-recognition in patient-generated data.J Am Med Inform Assoc. 2018 Oct 1;25(10):1366-1374. doi: 10.1093/jamia/ocy054. J Am Med Inform Assoc. 2018. PMID: 29905826 Free PMC article.
References
-
- International Diabetes Federation. Diabetes facts and figures [cited 2008 Nov 1] Available from: http://www.idf.org.
-
- Diabetes Control and Complications Trial (DCCT) Research Group. The effect of intensive treatment of diabetes on the development and progression of long-term complications in insulin-dependent diabetes mellitus. N Engl J Med. 1993;329(14):977–986. - PubMed
-
- UK Prospective Diabetes Study (UKPDS) Group. Intensive blood-glucose control with sulphonylureas or insulin compared with conventional treatment and risk of complications in patients with type 2 diabetes (UKPDS 33) Lancet. 1998;352(9131):837–853. - PubMed
-
- Holman RR, Paul SK, Bethel MA, Matthews DR, Neil HA. 10-year follow-up of intensive glucose control in type 2 diabetes. N Engl J Med. 2008;359(15):1577–1589. - PubMed
Publication types
MeSH terms
Substances
LinkOut - more resources
Full Text Sources
Medical
