. 2009 Jul 1;3(4):789-803.
doi: 10.1177/193229680900300428.

A feasibility study of bihormonal closed-loop blood glucose control using dual subcutaneous infusion of insulin and glucagon in ambulatory diabetic swine

Affiliations

A feasibility study of bihormonal closed-loop blood glucose control using dual subcutaneous infusion of insulin and glucagon in ambulatory diabetic swine

Firas H El-Khatib et al. J Diabetes Sci Technol. .

Abstract

Background: We sought to test the feasibility and efficacy of bihormonal closed-loop blood glucose (BG) control that utilizes subcutaneous (SC) infusion of insulin and glucagon, a model-predictive control algorithm for determining insulin dosing, and a proportional-derivative control algorithm for determining glucagon dosing.

Methods: Thirteen closed-loop experiments (approximately 7-27 h in length) were conducted in six ambulatory diabetic pigs weighing 26-50 kg. In all experiments, venous BG was sampled through a central line in the vena cava. Efficacy was evaluated in terms of the controller's ability to regulate BG in response to large meal disturbances ( approximately 5 g of carbohydrate per kilogram of body mass per meal) based only on regular frequent venous BG sampling and requiring only the subject's weight for initialization.

Results: Closed-loop results demonstrated successful BG regulation to normoglycemic range, with average insulin-to-carbohydrate ratios between approximately 1:20 and 1:40 U/g. The total insulin bolus doses averaged approximately 6 U for a meal containing approximately 6 g per kilogram body mass. Mean BG values in two 24 h experiments were approximately 142 and approximately 155 mg/dl, with the total daily dose (TDD) of insulin being approximately 0.8-1.0 U per kilogram of body mass and the TDD of glucagon being approximately 0.02-0.05 mg. Results also affirmed the efficacy of SC doses of glucagon in staving off episodic hypoglycemia.

Conclusions: We demonstrate the feasibility of bihormonal closed-loop BG regulation using a control system that employs SC infusion of insulin and glucagon as governed by an algorithm that reacts only to BG without any feed-forward information regarding carbohydrate consumption or physical activity. As such, this study can reasonably be regarded as the first practical implementation of an artificial endocrine pancreas that has a hormonally derived counterregulatory capability.


Figures

Figure 1.
Figure 1.
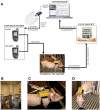
A paradigm (A) illustrating the setup of our closed-loop control system. The system components include an automatic FDA-approved bedside BG monitor (GlucoScout, International Biomedical, Inc.) that drew blood directly from the pig's central line, a computer that ran the control algorithm and a software script that automatically streamed BG values into the computer through a serial port connection from the GlucoScout, and two infusion pumps (Deltec CoZmo, Smiths Medical MD, Inc.) that were secured in a modified test tube rack on the pig's back and used to deliver SC doses of insulin and glucagon. Note that the infusion pumps were customized to be actuated by wireless Bluetooth signals from the control algorithm, which also allowed access to the finest mechanical resolution offered by these pumps (i.e., 50 nl) and thereby minimized round-off errors when delivering individual doses. An ambulatory pig (B) is shown inside the run while connected to the control system during a closed-loop experiment. During BG sampling, blood can be seen (C) in the central line near where the catheter exits on the back of the neck. Two infusion sets can be seen (D) inserted on the back of the neck, which are infused by two infusion pumps that are housed in the (yellow) modified test tube rack fixed on the pig's back. Note that the pig's central line was connected to the GlucoScout's sensor (white and blue rectangular pack) via an articulating (white) swivel joint (visible in C and D proximal to the sensor), which was secured with tethers to allow the pig maximum mobility inside the run.
Figure 2.
Figure 2.
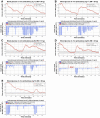
Results from two negative-control experiments (A and B) showing endogenous postprandial BG regulation as a function of time after a breakfast meal in two healthy (nondiabetic) pigs. Note the limited extent and duration of the BG excursion (BG never exceeded 140 mg/dl) from the normoglycemic range for a pig (30–80 mg/dl in venous blood), indicated by the shaded region. Beyond an initial mild hyperglycemic excursion, BG exhibited erratic fluctuations within or near the normoglycemic range. It is also noteworthy that the postprandial BG response to lunch or dinner meals in healthy pigs (not shown here) rarely exhibited any BG departure from the normoglycemic range. Results from three positive-control experiments (C–F) show postprandial dysregulation of BG in four diabetic pigs. In pigs 36 and 31 (C and D), BG was reduced with IV insulin to initial values within the normoglycemic range for a pig in order to provide contrast with endogenous control in healthy pigs as well as with the results of the closed-loop experiments in Figures 3A and 3B. In pigs 71 and 83 (E and F), BG was initially reduced to within the normoglycemic range for a human (60–120 mg/dl in venous blood), indicated by the shaded region, in order to provide a reference positive control for results of all closed-loop control experiments other than those of Figure 3A and 3B. All negative- and positive-control experiments commenced with virtually constant BG, with essentially no outstanding effect from the initial IV insulin bolus. All BG measurements were regularly obtained from vena cava blood sampling. A BG value of 600 mg/dl was used whenever the glucometer indicated a high BG, i.e., BG ≥ 600 mg/dl, which is outside the glucometer's range. BM, body mass.
Figure 3.
Figure 3.
Upper subpanels in each panel show BG results from six closed-loop control experiments in ambulatory diabetic pigs, while lower subpanels show insulin–glucagon doses, which were automatically determined in real time by the governing control algorithm (scales differ between panels). Experiments involved automatically regulating two meals, at least one of which contained a carbohydrate load of ∼6 g per kilogram of body mass, which is comparable to that used in the negative- and positive-control experiments shown in Figure 2. In A and B, BG was initially reduced to, and subsequently automatically regulated to, the normoglycemic range for a pig (30–80 mg/dl in venous blood), indicated by the shaded region, whereas in C–F, the pigs were initially hyperglycemic, and the controller automatically regulated BG to the normoglycemic range for a human (60–120 mg/dl in venous blood), indicated by the shaded region. Note that the initial hyperglycemic states in C–F were severe but not excessively high due to a continual subsistence level of open-loop insulin therapy being provided to the pigs prior to each experiment. In F, the control algorithm used successive glucagon doses to prevent a potentially severe hypoglycemic episode in the interval of ∼410–430 min, a situation that had resulted from an apparent sensor BG sampling error at ∼365 min that triggered a potentially excessive insulin dose. Note that ordinate scales vary. BM, body mass.
Figure 4.
Figure 4.
Top panel shows BG results from a closed-loop control experiment in an ambulatory diabetic pig, which lasted ∼27 h and of which 24 h followed an initial severe hyperglycemic state that was regulated to a mild hyperglycemic state at ∼180 min. During the course of the experiment, the pig was fed lunch, dinner, and breakfast (300, 200, and 250 g of carbohydrates, respectively), corresponding, respectively, to 6, 4, and 5 g of carbohydrates per kilogram of body mass. Note that the pig was asleep during most of the period between dinner and breakfast, with the excursion and heightened insulin requirement at ∼920–1040 min possibly being due to growth hormone secretion. The control system achieved an average BG of ∼142 ± 48 mg/dl (corresponding to a mean “virtual” A1C of ∼6.57%) with no incidences of hypoglycemia. A TDD of ∼39 U of insulin was administered by the controller in the 50 kg pig, with an average insulin-to-carbohydrate ratio (based on bolus doses, excluding the basal insulin component, within 5 h of all meals) of ∼1:36 U/g. Furthermore, the total amount of glucagon delivered was only ∼0.05 mg over a 24 h period (which is only 5–10% of the dose used clinically). The bottom panel shows the corresponding SC doses of insulin and glucagon, which were governed and determined in real time by the control algorithm.
Figure 5.
Figure 5.
Same interpretation as in Figure 4. The pig was fed lunch, dinner, and breakfast (152, 228, and 190 g of carbohydrates, respectively), corresponding, respectively, to 4, 6, and 5 g of carbohydrates per kilogram of body mass. Note that the pig was asleep for most of the period between dinner and breakfast, with an excursion and heightened insulin requirement at ∼960–1070 min, as observed in a similar period of sleep in the experiment of Figure 4. The control system achieved an average BG of ∼155 ± 36 mg/dl (corresponding to a mean “virtual” A1C of ∼7.03%) with no incidences of hypoglycemia. A TDD of ∼39 U of insulin was administered by the controller in the 38 kg pig, with an average insulin-to-carbohydrate ratio (based on bolus doses, excluding the basal insulin component, within 5 h of all meals) of ∼1:26 U/g. Furthermore, the total amount of glucagon delivered was only ∼0.024 mg over a 24 h period (which is less than 5% of the dose used clinically). At the end of the ∼27 h experiment, the pig was fed a meal that matched the last meal (breakfast) and the controller was switched off, thereby reemphasizing the inability of the diabetic pig to self-regulate BG postprandially, despite benefiting from preceding insulin bolus and basal doses outstanding in the SC tissue that were administered near the end of the closed-loop segment of the experiment.
Figure A1.
Figure A1.
Upper subpanels in each panel show BG results from five closed-loop control experiments in ambulatory diabetic pigs, while lower subpanels show insulin–glucagon doses, which were automatically determined in real time by the governing control algorithm (scales differ between panels). Four experiments A–D involved first automatically regulating a hyperglycemic state and then automatically regulating a single meal containing a carbohydrate load of 5–6 g per kilogram of body mass, which is comparable to that used in the negative- and positive-control experiments shown in Figure 2. One experiment (E) involved first automatically regulating a hyperglycemic state and then automatically regulating a small snack (35 g of cake frosting) that consisted solely of pure fast-acting carbohydrates (∼1 g of carbohydrates per 1 kg of body mass).The simple-carbohydrate snack was intended to challenge the control algorithm with a fast-rising BG response and a relatively fast subsequent decline in BG due to the lack of any delayed glucose release that complex carbohydrates might otherwise offer beyond the initial BG peak. The insulin bolus doses relative to carbohydrate content for the frosting snack was consistent with the dosing observed in all other closed-loop experiments involving complex carbohydrates (pig chow), with an average of ∼1 U per 30 g of carbohydrates. All five experiments involved regulating BG to the normoglycemic range in a human (60–120 mg/dl), indicated by the shaded region, starting from initial hyperglycemic states that were severe but not excessively high due to a continual subsistence level of open-loop insulin therapy being provided to the pigs prior to each experiment. Note that, in all five experiments, BG was successfully regulated to normoglycemic range with no occurrences of hypoglycemia. Note that ordinate scales vary.
Figure A2.
Figure A2.
Panel A shows results from the closed-loop control experiment in pig 83 that are presented in Figure 5, where the control system achieved a mean BG of 155 ± 36 mg/dl and administered a TDD of 38.9 U over 24 h (starting from t ≥ 180 min) in a 38 kg pig. The TDD was distributed by the closed-loop system as 14.4 U in basal doses (0.6 U/h, on average) and 24.5 U in bolus doses, which resulted in an overall insulin-to-carbohydrate ratio of 1:26 U/g. Panels B and C show two 24 h experiments that were conducted under open-loop mode in the same pig. In each open-loop experiment, the pig was fed three meals, which were identical to the three meals consumed under closed-loop control as shown in A, and received a basal rate of insulin of 0.6 U/h along with bolus insulin doses that were based on the carbohydrate content of each meal and the insulin-to-carbohydrate ratio of 1:26 U/g that was observed under closed-loop control. In the experiment of panel B, the bolus doses were administered as a single bolus dose per meal at the time the meal was provided, whereas, in the case of the experiment of panel C, square-wave boluses were administered over 30 min starting at the time each meal was provided. Thus the two open-loop experiments and the closed-loop experiment were all conducted in the same pig under the same carbohydrate challenge and using the same TDD of insulin. Furthermore, the distribution of the TDD of insulin between total basal and total bolus dose components was the same in all three experiments. Nevertheless, the BG regulation in both open-loop experiments was markedly inferior to that obtained under closed-loop control, with 24 h means in BG of ∼260 mg/dl under open-loop mode as opposed to 155 mg/dl under closed-loop control (in all cases, 24 h mean BG was computed for t ≥ 180 min after BG was near or within target range).

Similar articles

Cited by

References

    1. Klonoff DC. Benefits and limitations of self-monitoring of blood glucose. J Diabetes Sci Technol. 2007;1(1):130–132. - PMC - PubMed
    1. Jaremko J, Rorstad O. Advances toward the implantable artificial pancreas for treatment of diabetes. Diabetes Care. 1998;21(3):444–450. - PubMed
    1. The Diabetes Control and Complications Trial Research Group. The effect of intensive treatment of diabetes on the development and progression of long-term complications in insulin dependent diabetes mellitus. N Engl J Med. 1993;329(14):977–986. - PubMed
    1. Nathan DM, Cleary PA, Backlund JY, Genuth SM, Lachin JM, Orchard TJ, Raskin P, Zinman B. The Diabetes Control and Complications Trial/Epidemiology of Diabetes Interventions and Complications (DCCT/EDIC) Study Research Group. Intensive diabetes treatment and cardiovascular disease in patients with type 1 diabetes. N Engl J Med. 2005;353(25):2643–2653. - PMC - PubMed
    1. Renard E. Implantable closed-loop glucose-sensing and insulin delivery: the future for insulin pump therapy. Curr Opin Pharmacol. 2002;2(6):708–716. - PubMed

Publication types

MeSH terms