

Numerical and clinical accuracy of a continuous glucose monitoring system during intravenous insulin therapy in the surgical and burn intensive care units
- PMID: 20144345
- PMCID: PMC2769942
- DOI: 10.1177/193229680900300443
Numerical and clinical accuracy of a continuous glucose monitoring system during intravenous insulin therapy in the surgical and burn intensive care units
Abstract
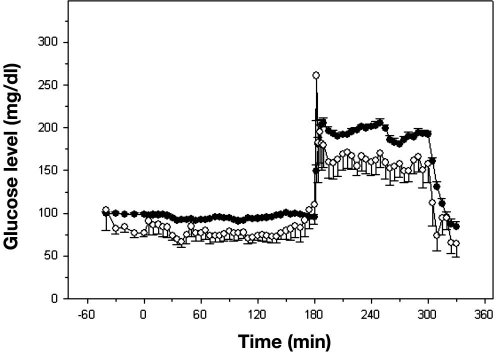
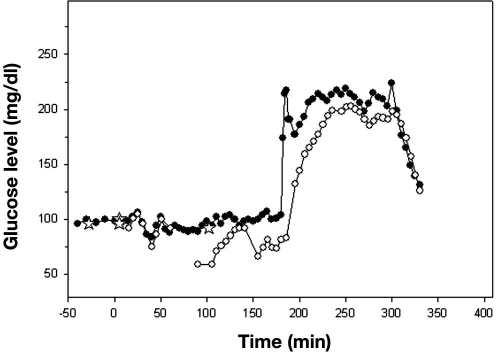
Background: Intensive insulin therapy (IIT) for glycemic control in critically ill patients has been shown to be beneficial. Continuous glucose monitoring systems (CGMSs) have been approved as an adjunct to complement standard glucose monitoring in type 2 diabetes mellitus. This study was designed to evaluate the accuracy of a real-time CGMS (DexCom STS) in the intensive care unit (ICU). We also evaluated its reliability and accuracy using a hyperinsulinemic-euglycemic and a hyperglycemic clamp study.
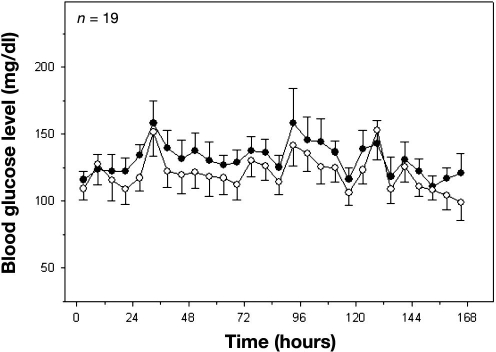
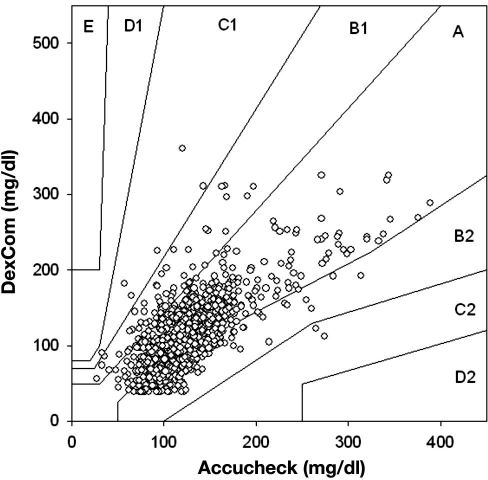
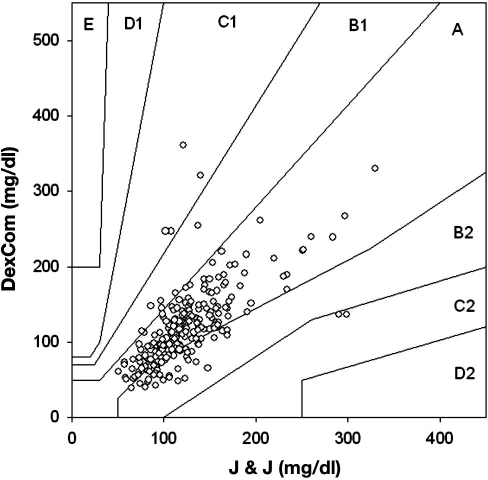
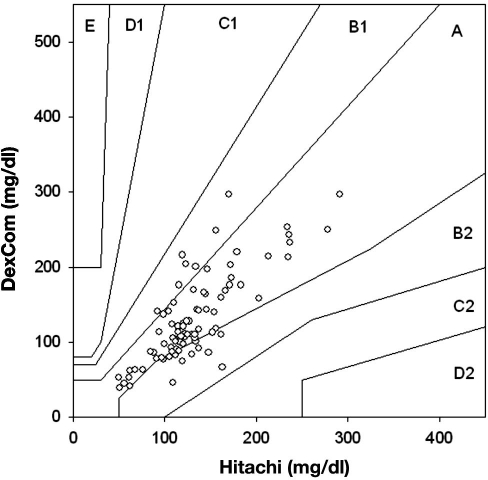
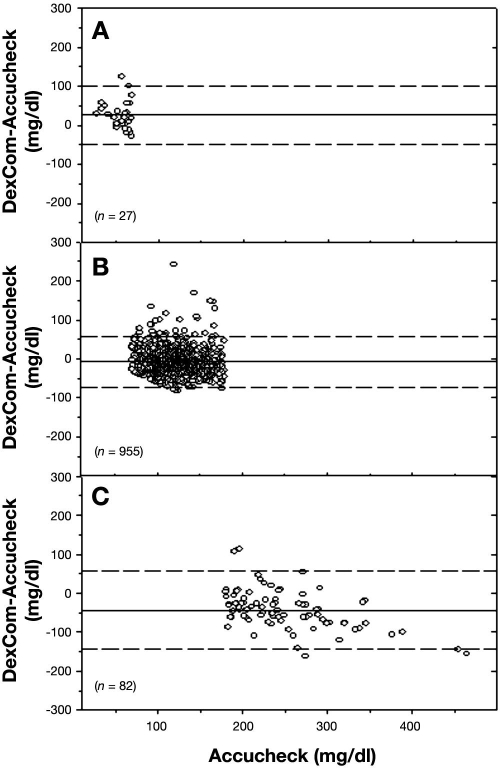
Methods: Nineteen patients were enrolled in this 7-day study [13 = surgical intensive care unit (SICU), 6 = burn intensive care unit (BICU)]. The patients were on IIT for at least 2 h prior the subcutaneous sensor insertion. Mean age and body mass index for SICU and BICU patients were 60.3 +/- 3.7 and 64.5 +/- 6.2 years and 36.6 +/- 5.0 and 33.85 +/- 3.4 kg/m2, respectively. DexCom accuracy was analyzed separately for the Johnson & Johnson (J&J) calibration finger sticks, Roche Accucheck finger sticks, and the Hitachi 917 analyzer measurements on serum using Clarke error grid analysis and Bland-Altman analysis. In the clamp studies, 20 patients were enrolled, and the data were analyzed similarly.
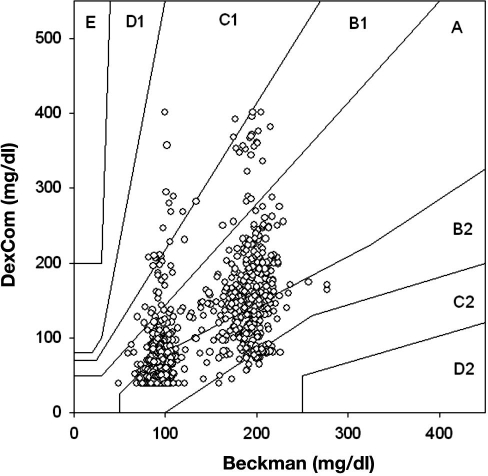
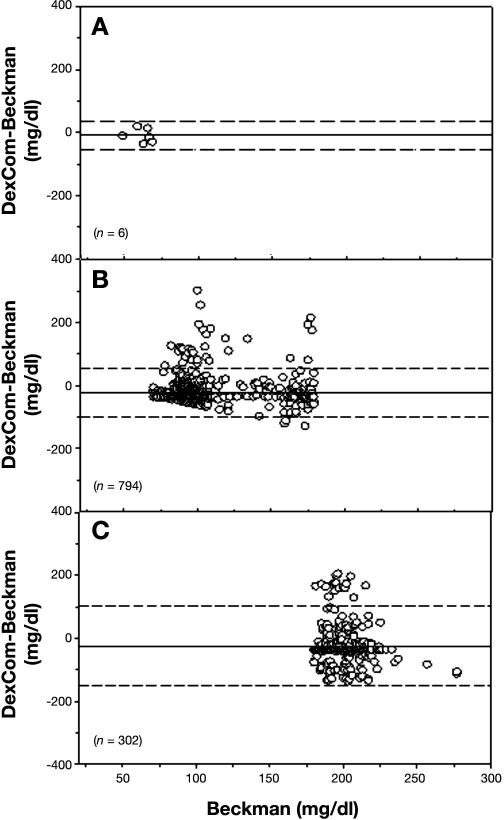
Results: There were 1065 pairs of DexCom-Accucheck, 232 pairs of DexCom-J&J, and 84 pairs of DexCom-Hitachi in ICU patients. For DexCom-Accucheck, 68.26% of the pairs fell into zone A, 31.83% into zone B, and 0.75% into zone C. There were no values in zones D or E. From the 1102 matching DexCom-Beckman pairs in clamp studies, 42.29% were in zone A, 55.90% were in zone B, and 4.08% were in zone C.
Conclusions: Despite the high percentage of measurements in zones A and B, underestimation of hypoglycemia by DexCom measurements makes it an unreliable device in the ICU setting.
Copyright 2009 Diabetes Technology Society.
Figures
Similar articles
-
Continuous Glucose Monitoring Using the Dexcom G6 in Cardiac Surgery During the Postoperative Period.Endocr Pract. 2024 Jul;30(7):610-615. doi: 10.1016/j.eprac.2024.04.015. Epub 2024 Apr 30. Endocr Pract. 2024. PMID: 38692488
-
Continuous Glucose Monitoring in Critically Ill Patients With COVID-19: Results of an Emergent Pilot Study.J Diabetes Sci Technol. 2020 Nov;14(6):1065-1073. doi: 10.1177/1932296820964264. Epub 2020 Oct 16. J Diabetes Sci Technol. 2020. PMID: 33063556 Free PMC article.
-
Performance of Subcutaneous Continuous Glucose Monitoring in Adult Critically Ill Patients Receiving Vasopressor Therapy.Diabetes Technol Ther. 2024 Oct;26(10):763-772. doi: 10.1089/dia.2024.0035. Epub 2024 May 31. Diabetes Technol Ther. 2024. PMID: 38758211
-
Glucose control in the intensive care unit.Crit Care Med. 2009 May;37(5):1769-76. doi: 10.1097/CCM.0b013e3181a19ceb. Crit Care Med. 2009. PMID: 19325461 Review.
-
Towards closed-loop glycaemic control.Best Pract Res Clin Anaesthesiol. 2009 Mar;23(1):69-80. doi: 10.1016/j.bpa.2008.07.003. Best Pract Res Clin Anaesthesiol. 2009. PMID: 19449617 Review.
Cited by
-
The accuracy and efficacy of real-time continuous glucose monitoring sensor in Chinese diabetes patients: a multicenter study.Diabetes Technol Ther. 2012 Aug;14(8):710-8. doi: 10.1089/dia.2012.0014. Diabetes Technol Ther. 2012. PMID: 22853722 Free PMC article.
-
Diabetes Technology Update: Use of Insulin Pumps and Continuous Glucose Monitoring in the Hospital.Diabetes Care. 2018 Aug;41(8):1579-1589. doi: 10.2337/dci18-0002. Epub 2018 Jun 23. Diabetes Care. 2018. PMID: 29936424 Free PMC article. Review.
-
Performance of the Medtronic Sentrino continuous glucose management (CGM) system in the cardiac intensive care unit.BMJ Open Diabetes Res Care. 2014 Jul 21;2(1):e000037. doi: 10.1136/bmjdrc-2014-000037. eCollection 2014. BMJ Open Diabetes Res Care. 2014. PMID: 25452874 Free PMC article.
-
Real-time continuous glucose monitoring shows high accuracy within 6 hours after sensor calibration: a prospective study.PLoS One. 2013;8(3):e60070. doi: 10.1371/journal.pone.0060070. Epub 2013 Mar 28. PLoS One. 2013. PMID: 23555886 Free PMC article.
-
Accuracy of Intra-arterial and Subcutaneous Continuous Glucose Monitoring in Postoperative Cardiac Surgery Patients in the ICU.J Diabetes Sci Technol. 2015 May;9(3):663-7. doi: 10.1177/1932296814564993. Epub 2014 Dec 23. J Diabetes Sci Technol. 2015. PMID: 25539652 Free PMC article.
References
-
- De Block C, Manuel YKB, Van Gaal L, Rogiers P. Intensive insulin therapy in the intensive care unit: assessment by continuous glucose monitoring. Diabetes Care. 2006;29(8):1750–1756. - PubMed
-
- Finnerty CC, Herndon DN, Przkora R, Pereira CT, Oliveira HM, Queiroz DM, Rocha AM, Jeschke MG. Cytokine expression profile over time in severely burned pediatric patients. Shock. 2006;26(1):13–19. - PubMed
-
- Mizock BA. Alterations in carbohydrate metabolism during stress: a review of the literature. Am J Med. 1995;98(1):75–84. - PubMed
-
- Clement S, Braithwaite SS, Magee MF, Ahmann A, Smith EP, Schafer RG, Hirsch IB American Diabetes Association Diabetes in Hospitals Writing Committee. Management of diabetes and hyperglycemia in hospitals. Diabetes Care. 2004;27(2):553–591. - PubMed
-
- Black CT, Hennessey PJ, Andrassy RJ. Short-term hyperglycemia depresses immunity through nonenzymatic glycosylation of circulating immunoglobulin. J Trauma. 1990;30(7):830–832. discussion 832–3. - PubMed
Publication types
MeSH terms
Substances
Grants and funding
LinkOut - more resources
Full Text Sources
Other Literature Sources
Medical
