Review
. 2009 Mar 1;3(2):242-52.
doi: 10.1177/193229680900300204.

Single walled carbon nanotubes as reporters for the optical detection of glucose

Affiliations
Review

Single walled carbon nanotubes as reporters for the optical detection of glucose

Paul W Barone et al. J Diabetes Sci Technol. .

Abstract

This article reviews current efforts to make glucose sensors based on the inherent optical properties of single walled carbon nanotubes. The advantages of single walled carbon nanotubes over traditional organic and nanoparticle fluorophores for in vivo-sensing applications are discussed. Two recent glucose sensors made by our group are described, with the first being an enzyme-based glucose sensor that couples a reaction mediator, which quenches nanotube fluorescence, on the surface of the nanotube with the reaction of the enzyme. The second sensor is based on competitive equilibrium binding between dextran-coated nanotubes and concanavalin A. The biocompatibility of a model sensor is examined using the chicken embryo chorioallantoic membrane as a tissue model. The advantages of measuring glucose concentration directly, like most optical sensors, versus measuring the flux in glucose concentration, like most electrochemical sensors, is discussed.


Figures

Figure 1.
Figure 1.
Implantable glucose sensor based on SWNT nIR fluorescence. (A) A porous dialysis capillary contains fluorescent glycosylated SWNT that shift their emission wavelength based on adsorption of a glucose-binding macromolecule. Free glucose diffuses into the capillary and replaces the bound entity, creating a reversible response. A porous, hydrogel allows slow release of angiogenic and anti-inflammatory factors to minimize fibrous encapsulation and biofouling. (B) The implanted device can be queried passively through the skin using near infrared light. (C) Image of SWNT-filled capillary embedded under rat skin acquired with the CRi Maestro in vivo imaging system with excitation from 649 to 690 nm, emission from 800 to 950 nm, a 5-second exposure, and 10 accumulations.
Figure 2.
Figure 2.
(A) Absorption coefficient of human whole blood (the dominant absorber for in vivo applications) for oxygenated, deoxygenated, and the average value. Potential fluorophores are compared. (B) Depth profile of a SWNT test sensor platform through chicken breast tissue. Measurement was made using the Maestro in vivo imaging system with excitation from 649 to 690 nm, emission from 800 to 950 nm, a 5-second exposure, and 10 accumulations. a.u., arbitrary unit. (Inset) nIR image of the SWNT-filled capillary proxy through chicken. The chicken breast is false colored in white, and the SWNT fluorescence is false colored in red.
Figure 3.
Figure 3.
(A) Dialysis in the presence of glucose oxidase yields protein-stabilized nanotubes as monitored optically using transient emission. In the absence of enzyme (blue), the system aggregates rapidly. Assembly can be tracked using the 10-meV shift in wavelength (inset). a.u., arbitrary unit. (B) Atomic force microscope images of enzyme-suspended nanotubes on mica reveal average heights of 4.4 nm that correspond to a monolayer of dimers.
Figure 4.
Figure 4.
(A) A 200 mm × 1 cm, 13-kDa microdialysis capillary, shown to scale on a human finger, is loaded with the nanotube solution allowing glucose to diffuse through the membrane with containment of the sensing medium. Placing the capillary beneath a human epidermal tissue sample (above), we can clearly map the nanotube fluorescence from the capillary, seen in the two-dimensional profile. (B) After ferricyanide surface reaction at 37°C and pH buffered at 7.4 (i), the fluorescence response to the addition of 1.4, 2.4, and 4.2 mM glucose is scaled by the difference between minimum and maximum intensities. (C) The response function relates the normalized intensity to the local glucose concentration in the range of blood glucose detection with a type I absorption isotherm.
Figure 5.
Figure 5.
(A) Schematic of affinity glucose sensor operation. Dextran-coated nanotubes will aggregate in the presence of Con A, decreasing measured fluorescence. The addition of glucose results in aggregate dissolution and fluorescence recovery. (B) The addition of Con A to dextran-suspended nanotubes results in a 90% decrease in SWNT fluorescence and visible nanotube aggregation. (C) The subsequent addition of glucose causes nanotube aggregate dissolution and fluorescence recovery.
Figure 6.
Figure 6.
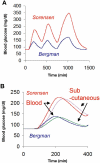
(A) Simulation of blood glucose levels of a healthy patient using the Sorensen (red) and Bergman (blue) models and a three-meal protocol described in the text. (B) Calculated subcutaneous glucose profiles using a mass transport model with a rate constant of 0.04 min-1 showing a 30-minute lag for both models
Figure 7.
Figure 7.
Effect of biofouling on the model responses of two types of glucose sensors. (A) An electrochemical sensor measures the flux of glucose to the electrode and exhibits signal distortion immediately as the effective membrane area is reduced. The sensor produces a 20% error after 3.7 days. (B) The same biofouling rate and initial area yield no diminution in an optical sensor response for more than 76 days. Constant parameter values were assumed for each sensor: D = 6.7 × 10⁻⁶ m2/s, L = 10-5, A0 = 2 × 10⁻⁶ m2, V = 3.1 × 10⁻¹⁰ m3, kf = 5 × 10⁻⁵ min-1.
Figure 8.
Figure 8.
(A) A capillary placed on CAM for 2 hours. (B) A capillary placed on CAM for 9 days. (C) Hematoxylin and eosin (H&E) stain of normal CAM morphology. (D) H&E stain of capillary in CAM. A high density of heterophils and other acute inflammatory cells was observed around the capillary. (E) H&E stain of PEG-coated capillary in CAM. A very little inflammatory response was observed. (F) H&E stain of thread in CAM. Several layers of fibroblast encapsulation and severe inflammatory response were observed around the thread. H, heterophils; L, leukocytes (mostly macrophages and giant cells); F, fibroblast encapsulation induced by the thread; T, thread fibers within the tissue.

Similar articles

Cited by

References

    1. Diabetes atlas. 2nd ed. International Diabetes Federation; 2003.
    1. The Diabetes Control and Complications Trial Research Group. The effect of intensive treatment of diabetes on the development and progression of long-term complications in insulin-dependent diabetes-mellitus. N Engl J Med. 1993;329(14):977–986. - PubMed
    1. Barnett AH. Treating to goal: challenges of current management. Eur J Endocrinol. 2004;151(Suppl 2):T3–T7. discussion T29-30. - PubMed
    1. The absence of a glycemic threshold for the development of long-term complications. The perspective of the Diabetes Control and Complications Trial. Diabetes. 1996 Oct;45(10):1289–1298. - PubMed
    1. Wickramasinghe Y, Yang Y, Spencer SA. Current problems and potential techniques in in vivo glucose monitoring. J Fluoresc. 2004;14(5):513–520. - PubMed

Publication types