

Display of glucose distributions by date, time of day, and day of week: new and improved methods
- PMID: 20144393
- PMCID: PMC2787039
- DOI: 10.1177/193229680900300619
Display of glucose distributions by date, time of day, and day of week: new and improved methods
Abstract
Objective: There is a need for improved methods for display of glucose distributions to facilitate comparisons by date, time of day, day of the week, and other variables for data obtained using self-monitoring of blood glucose (SMBG) and continuous glucose monitoring (CGM).
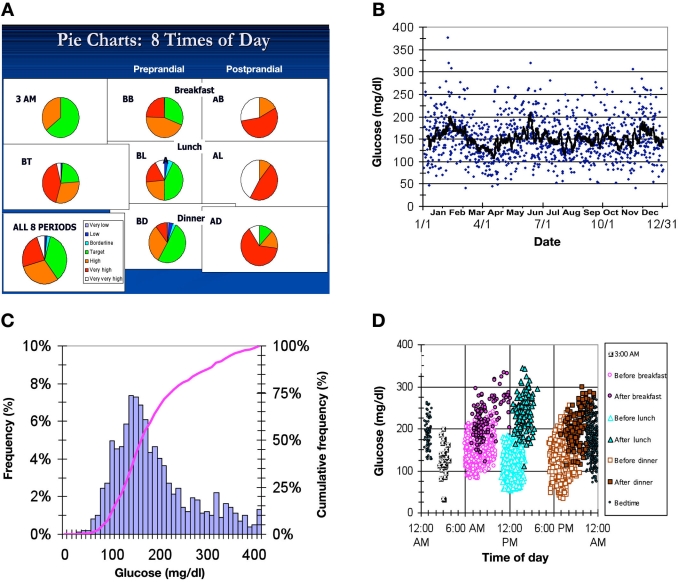
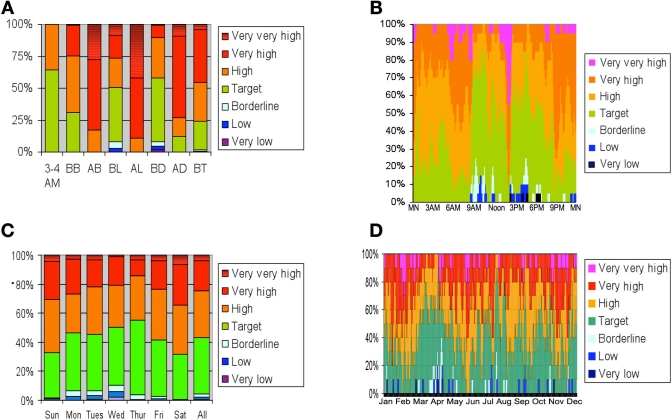
Method: Stacked bar charts are utilized for multiple ranges of glucose values, e.g., very low, low, borderline low, target range, borderline high, high, and very high. Glucose ranges for these categories can be defined by the user, e.g., <40, 40-70, 71-80, 81-140, 141-180, 181-250, and 251-400 mg/dl. Glucose distributions can be displayed by time of day, in relation to meals, by date, or by day of week. The graphic display can be generated using general purpose spreadsheet software such as Microsoft Excel or with special purpose software.
Result: Stacked bar charts are extremely compact and effective. They facilitate comparison of multiple days, multiple time segments within a day, preprandial and postprandial glucose levels, days of the week, treatment periods, patients, and groups of patients. They are superior to use of pie charts in terms of compactness and in their ability to facilitate comparisons using multiple criteria and multiple subsets of the data. One can identify episodes of hypoglycemia and hyperglycemia and can display standard errors of estimates of percentages. Interpretation of these graphs is readily learned and requires minimal training.
Conclusion: Use of stacked bar charts is generally superior to use of pie charts for display of glucose distributions and can potentially facilitate the analysis and interpretation of SMBG and CGM data.
Figures
Similar articles
-
A semilogarithmic scale for glucose provides a balanced view of hyperglycemia and hypoglycemia.J Diabetes Sci Technol. 2009 Nov 1;3(6):1395-401. doi: 10.1177/193229680900300620. J Diabetes Sci Technol. 2009. PMID: 20144394 Free PMC article.
-
Treatment satisfaction and quality of life for an integrated continuous glucose monitoring/insulin pump system compared to self-monitoring plus an insulin pump.J Diabetes Sci Technol. 2009 Nov 1;3(6):1402-10. doi: 10.1177/193229680900300621. J Diabetes Sci Technol. 2009. PMID: 20144395 Free PMC article.
-
New approaches to display of self-monitoring of blood glucose data.J Diabetes Sci Technol. 2009 Sep 1;3(5):1121-7. doi: 10.1177/193229680900300515. J Diabetes Sci Technol. 2009. PMID: 20144425 Free PMC article.
-
Continuous Glucose Monitoring: A Review of Recent Studies Demonstrating Improved Glycemic Outcomes.Diabetes Technol Ther. 2017 Jun;19(S3):S25-S37. doi: 10.1089/dia.2017.0035. Diabetes Technol Ther. 2017. PMID: 28585879 Free PMC article. Review.
-
Continuous glucose monitoring: a review of the evidence, opportunities for future use and ongoing challenges.Intern Med J. 2018 May;48(5):499-508. doi: 10.1111/imj.13770. Intern Med J. 2018. PMID: 29464891 Review.
Cited by
-
Approaches to display of multiple-point glucose profiles: A UK patient's perspective.J Diabetes Sci Technol. 2014 Nov;8(6):1233-8. doi: 10.1177/1932296814541245. Epub 2014 Jul 2. J Diabetes Sci Technol. 2014. PMID: 25355715 Free PMC article. Review.
-
Self-adjustment of insulin dose using graphically depicted self-monitoring of blood glucose measurements in patients with type 1 diabetes mellitus.J Diabetes Sci Technol. 2013 Jan 1;7(1):156-62. doi: 10.1177/193229681300700119. J Diabetes Sci Technol. 2013. PMID: 23439172 Free PMC article. Clinical Trial.
-
Statistical Packages and Algorithms for the Analysis of Continuous Glucose Monitoring Data: A Systematic Review.J Diabetes Sci Technol. 2025 May;19(3):787-809. doi: 10.1177/19322968231221803. Epub 2024 Jan 5. J Diabetes Sci Technol. 2025. PMID: 38179940 Free PMC article.
-
Consensus report: the current role of self-monitoring of blood glucose in non-insulin-treated type 2 diabetes.J Diabetes Sci Technol. 2011 Nov 1;5(6):1529-48. doi: 10.1177/193229681100500630. J Diabetes Sci Technol. 2011. PMID: 22226276 Free PMC article.
-
New Paradigm of Personalized Glycemic Control Using Glucose Temporal Density Histograms.J Diabetes Sci Technol. 2019 Jul;13(4):708-717. doi: 10.1177/1932296818821423. Epub 2019 Jan 8. J Diabetes Sci Technol. 2019. PMID: 30616388 Free PMC article.
References
-
- Berger M, Jaffe ML, Devine P, Rodbard D. Computer programs to assist the physician in the analysis of self-monitored blood glucose data. Proc Annu Symp Comput Appl Med Care. 1988;9:52–57.
-
- Pernick NL, Rodbard D. Personal computer programs to assist with self-monitoring of blood glucose and self-adjustment of insulin dosage. Diabetes Care. 1986;9(1):61–69. - PubMed
-
- Mazze RS, Lucido D, Langer O, Hartmann K, Rodbard D. Ambulatory glucose profile: representation of verified self-monitored blood glucose data. Diabetes Care. 1987;10(1):111–117. - PubMed
-
- Rodbard D. Potential role of computers in clinical investigation and management of diabetes mellitus. Diabetes Care. 1988;11(Suppl 1):54–61. - PubMed
-
- Rodbard D, Berger M, Pernick N. Computer, networking, and information systems to facilitate delivery of health care to patients with diabetes. In: Baba S, Kaneko T, editors. Diabetes 1994; Proceedings of the 15th International Diabetes Federation Congress; 6-11 November 1994; Kobe. New York: Elsevier; 1995. pp. 800–803.
MeSH terms
Substances
LinkOut - more resources
Full Text Sources
Other Literature Sources
Medical
