

A semilogarithmic scale for glucose provides a balanced view of hyperglycemia and hypoglycemia
- PMID: 20144394
- PMCID: PMC2787040
- DOI: 10.1177/193229680900300620
A semilogarithmic scale for glucose provides a balanced view of hyperglycemia and hypoglycemia
Abstract
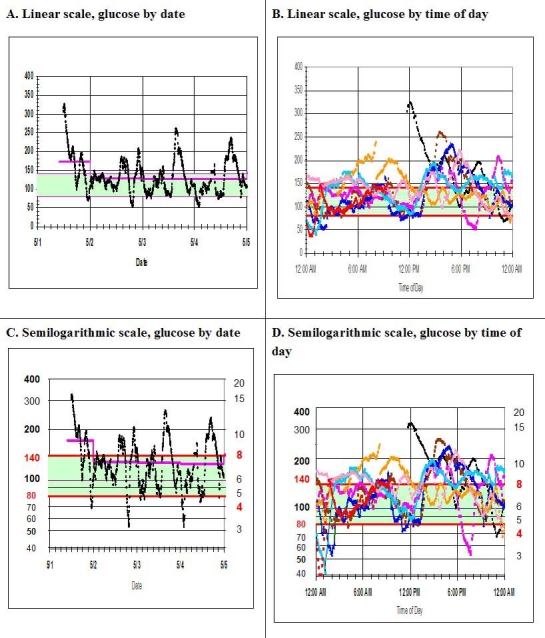
Objective: It would be desirable to improve the ability of physicians and patients to identify hypoglycemic episodes when viewing displays of glucose by date, time of day, or day of the week.
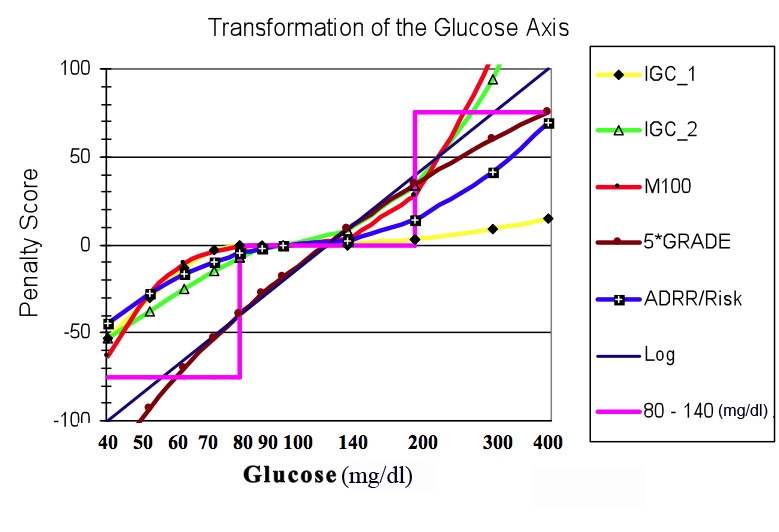
Research design and methods: A logarithmic scale is utilized for display of glucose versus date and time of day using a range of 40 to 400 mg/dl. Several plausible alternatives are considered for transformation of the glucose data.
Result: Use of a semilogarithmic plot triples the percentage of the vertical axis allocated to hypoglycemia (e.g., 40-80 mg/dl) from 10% to 30.1% while compressing the hyperglycemic region. The log scale improves the symmetry of the glucose distribution. Transformations were evaluated corresponding to the Schlichtkrull M(100) value, the high blood glucose index/low blood glucose index of Kovatchev and associates, an index of glycemic control developed by the present author, and the GRADE score of Hill and coworkers. Results are similar for all four transformations. This approach is applicable both to self-monitoring of blood glucose (SMBG) and continuous glucose monitoring (CGM). Based on preliminary results, it is proposed that the log transform could potentially facilitate analysis of glucose patterns and may facilitate rapid and consistent detection and appreciation of the severity and consistency of hypoglycemic episodes, even in the presence of complex overlapping patterns commonly observed in both SMBG and CGM glucose profiles.
Conclusion: Display of glucose on a logarithmic scale can potentially improve the accuracy of analysis and interpretation of popular methods for graphic display of glucose values. Device manufacturers should consider including options for semilogarithmic display of glucose on SMBG meters, CGM sensors, and software for retrospective analyses of glucose data.
Figures
References
-
- The Diabetes Control and Complications Trial Research Group. Hypoglycemia in the Diabetes Control and Complications Trial. Diabetes. 1997;46(2):271–286. - PubMed
-
- Skyler JS, Bergenstal R, Bonow RO, Buse J, Deedwania P, Gale EA, Howard BV, Kirkman MS, Kosiborod M, Reaven P, Sherwin RS. American Diabetes Association, American College of Cardiology Foundation, American Heart Association. Intensive glycemic control and the prevention of cardiovascular events: implications of the ACCORD, ADVANCE, and VA Diabetes Trials: a position statement of the American Diabetes Association and a Scientific Statement of the American College of Cardiology Foundation and the American Heart Association. J Am Coll Cardiol. 2009;53(3):298–304. - PubMed
-
- American Diabetes Association. Veterans Administration Diabetes Trial. http://www.diabetesconnect.org/storetemplate/CVDPackage.aspx Accessed September 23, 2009.
-
- Garg S, Zisser H, Schwartz S, Bailey T, Kaplan R, Ellis S, Jovanovic L. Improvement in glycemic excursions with a trans-cutaneous, real-time continuous glucose sensor: a randomized controlled trial. Diabetes Care. 2006;29(1):44–50. - PubMed
-
- Garg S, Jovanovic L. Relationship of fasting and hourly blood glucose levels to HbA1c values: safety, accuracy, and improvements in glucose profiles obtained using a 7-day continuous glucose sensor. Diabetes Care. 2006;29(12):2644–2649. - PubMed
MeSH terms
Substances
LinkOut - more resources
Full Text Sources
Other Literature Sources
Medical
