Review
. 2009 Sep 1;3(5):1005-13.
doi: 10.1177/193229680900300503.

Glucose clamp algorithms and insulin time-action profiles

Affiliations
Review

Glucose clamp algorithms and insulin time-action profiles

B Wayne Bequette. J Diabetes Sci Technol. .

Abstract

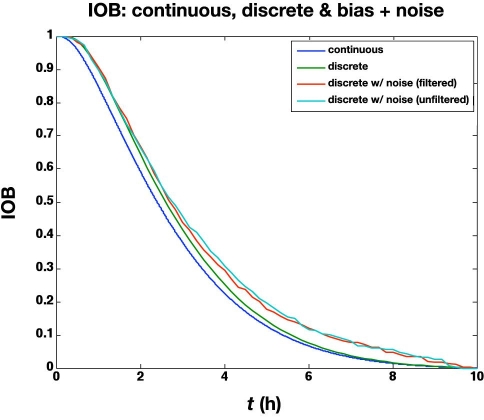
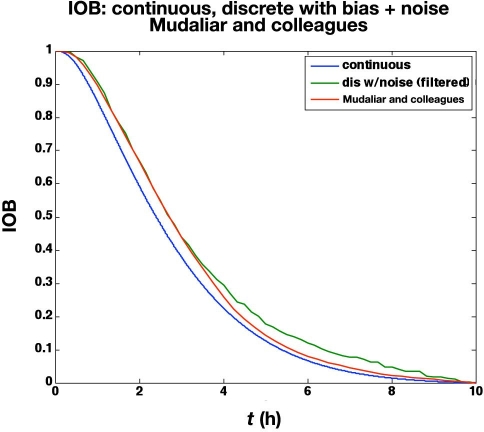
Motivation: Most current insulin pumps include an insulin-on-board (IOB) feature to help subjects avoid problems associated with "insulin stacking." In addition, many control algorithms proposed for a closed-loop artificial pancreas make use of IOB to reduce the probability of hypoglycemic events that often occur due to the integral action of the controller. The IOB curves are generated from the pharmacodynamic (time-activity profiles) actions of subcutaneous insulin, which are obtained from glycemic clamp studies.

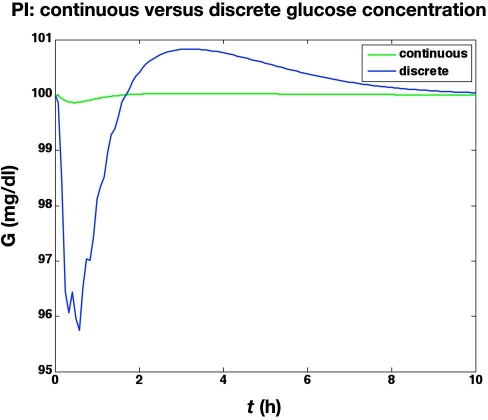
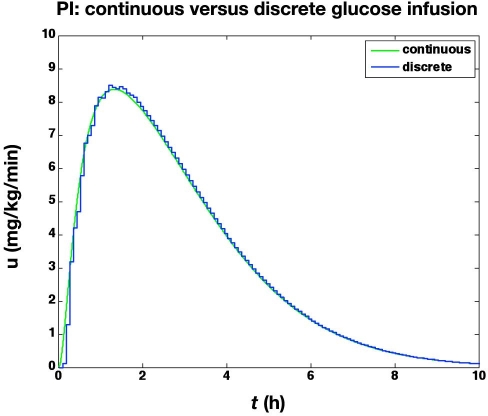
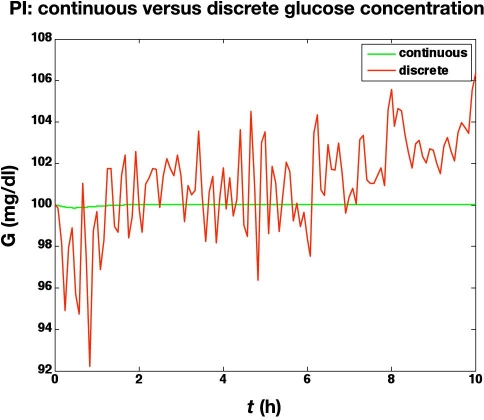
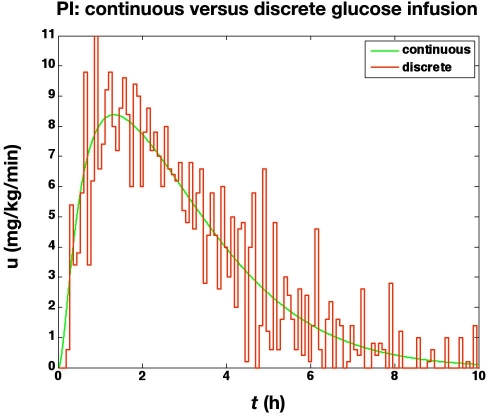
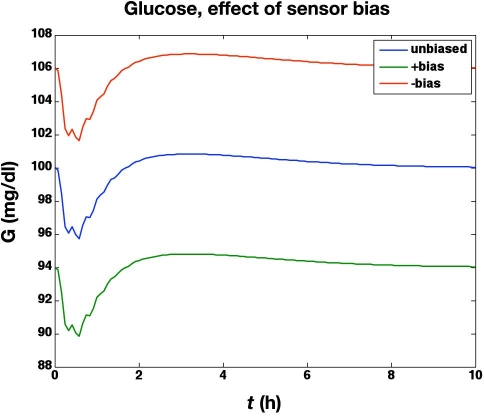
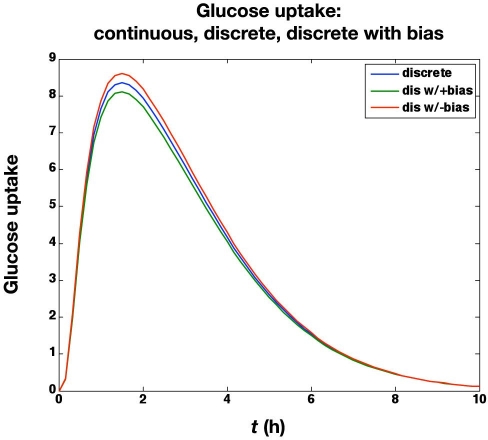
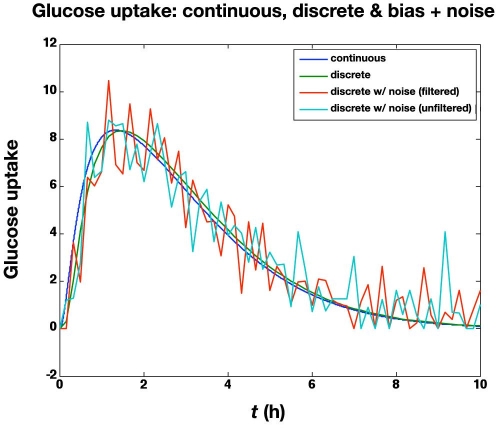
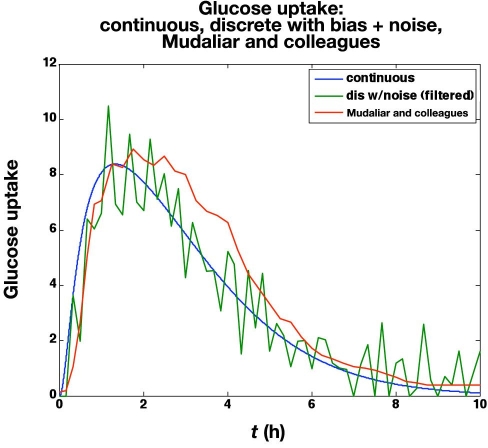
Methods: Glycemic clamp algorithms are reviewed and in silico studies are performed to analyze the effect of glucose meter bias and noise on glycemic control and the manipulated glucose infusion rates. The glucose infusion rates are used to obtain insulin time-activity profiles, which are then used to generate IOB curves.

Results: A model-based, three-step-ahead controller is shown to be equivalent to a proportional-integral control algorithm with time-delay compensation. A systematic glucose meter bias of +6 mg/dl results in a decrease in the glucose area under the curve of 3% but no change in the IOB profiles.

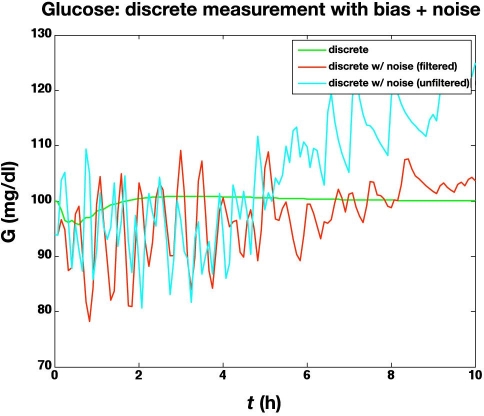
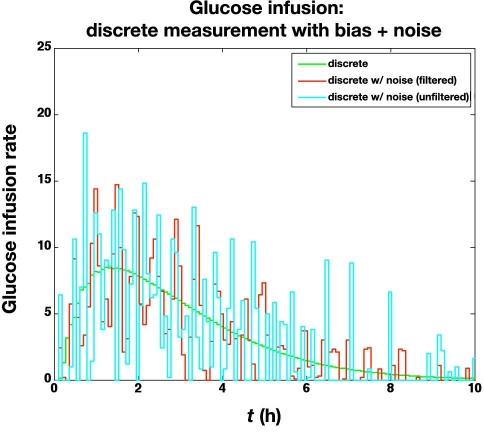
Conclusions: Based on these preliminary simulation studies, a substantial amount of glucose meter bias and noise during a glycemic clamp can be tolerated with little net effect on the IOB curves. It is suggested that handheld glucose meters can therefore be used in clamp studies if the measurements are filtered (averaged) before processing by the control algorithm. Clinical studies are needed to confirm these preliminary results.


Figures

Figure 1.
Figure 1.
Blood glucose values from the simulated glycemic clamp procedure. Comparison of (i) continuous and (ii) discrete controllers with no measurement noise (the discrete controller has a sample delay of 2 min).
Figure 2.
Figure 2.
The glucose infusion rates (mg/kg/min) from the glucose clamp shown in Figure 1.
Figure 3.
Figure 3.
Glucose values from the simulated glycemic clamp procedure. Comparison of a continuous (and noise-free) PI controller with a discrete PI controller with measurement noise (standard deviation of 1 mg/dl), measurement (integer values, mg/dl) and pump finite resolution (0.1 mg/kg/min), and a sample delay of 2 min.
Figure 4.
Figure 4.
The glucose infusion rates (mg/kg/min) from the glucose clamp shown in Figure 3.
Figure 5.
Figure 5.
Effect of glucose meter bias (±6 mg/dl) on actual blood glucose concentrations during a euglycemic clamp. Since the controller is regulating glucose to a set point of 100 mg/dl based on the glucose meter readings, +6 and −6 mg/dl biases result in actual glucose values of 94 and 106 mg/dl, respectively.
Figure 6.
Figure 6.
Effect of glucose meter bias (± 6 mg/dl) on the glucose uptake rate (mg/kg/min).
Figure 7.
Figure 7.
Comparison of glucose concentrations for the following controllers: discrete (with no noise) and discrete with bias and substantial noise (filtered and unfiltered measurements). The actual glucose concentrations are plotted.
Figure 8.
Figure 8.
Comparison of glucose infusion rates (mg/kg/min) for the following controllers: discrete (with no noise) and discrete with bias and substantial noise (control algorithm based on filtered and unfiltered measurements).
Figure 9.
Figure 9.
Comparison of time-action profiles (glucose uptake rate, mg/kg/min) for continuous, discrete (no noise), and discrete with bias (+6 mg/dl) and substantial noise (standard deviation = 5 mg/dl; filtered and unfiltered).
Figure 10.
Figure 10.
Comparison of IOB profiles for the results in Figure 9.
Figure 11.
Figure 11.
Comparison of time-action profiles (glucose uptake rate, mg/kg/min) for continuous, discrete with bias (+6 mg/dl) and substantial noise (standard deviation = 5 mg/dl; filtered), and the curve published by Mudaliar and colleagues (scaled by 75 kg).
Figure 12.
Figure 12.
Comparison of IOB curves for the time-action profiles in Figure 11.

Similar articles

Cited by

References

    1. Ellingsen C, Dassau E, Zisser H, Grosman B, Percival MW, Jovanovič L, Doyle FJ., III Safety constraints in an artificial pancreatic β cell: an implementation of model predictive control with insulin on board. J Diabetes Sci Technol. 2009;3(3):536–544. - PMC - PubMed
    1. Lee H, Buckingham BA, Bequette BW. An insulin-on-board formulation of a proportional-integral-derivative controller for a closed-loop artificial pancreas. J Diabetes Sci Technol. 2009;3(2):A101.
    1. Walsh J, Roberts R. 4th ed. San Diego: Torrey Pines Press; 2006. Pumping insulin.
    1. Zisser H, Robinson L, Bevier W, Dassau E, Ellingsen C, Doyle FJ, Jovanovic L. Bolus calculator: a review of four “smart” insulin pumps. Diabetes Technol Ther. 2008;10(6):441–444. - PubMed
    1. Heinemann L. Mainz: Verlag Kirchheim; 2004. Time-action profiles of insulin preparations. http://www.profil-research.de/downloads/publikationen/buch.pdf.

Publication types

MeSH terms