

Identification of intraday metabolic profiles during closed-loop glucose control in individuals with type 1 diabetes
- PMID: 20144418
- PMCID: PMC2769900
- DOI: 10.1177/193229680900300508
Identification of intraday metabolic profiles during closed-loop glucose control in individuals with type 1 diabetes
Abstract
Background: Algorithms for closed-loop insulin delivery can be designed and tuned empirically; however, a metabolic model that is predictive of clinical study results can potentially accelerate the process.
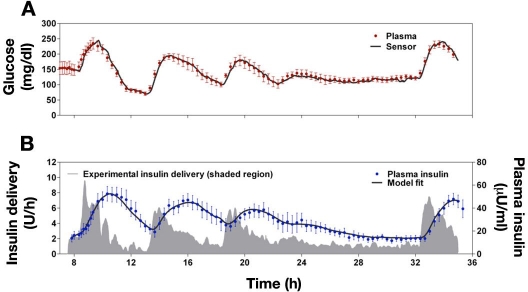
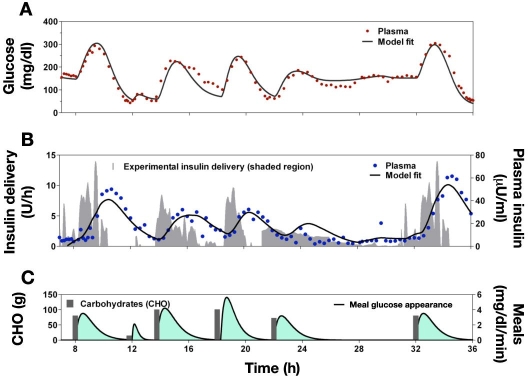
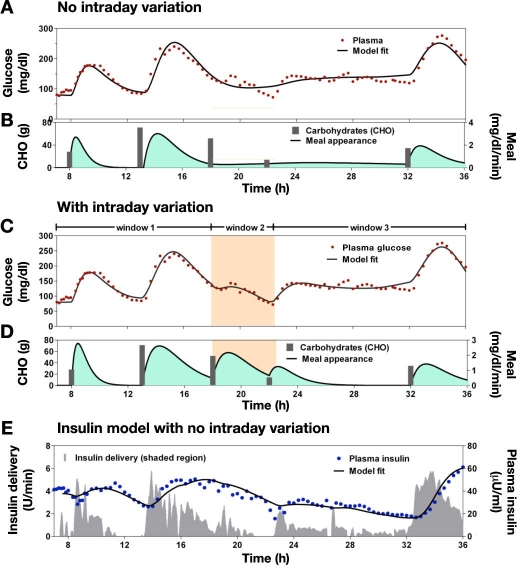
Methods: Using data from a previously conducted closed-loop insulin delivery study, existing models of meal carbohydrate appearance, insulin pharmacokinetics, and the effect on glucose metabolism were identified for each of the 10 subjects studied. Insulin's effects to increase glucose uptake and decrease endogenous glucose production were described by the Bergman minimal model, and compartmental models were used to describe the pharmacokinetics of subcutaneous insulin absorption and glucose appearance following meals. The composite model, comprised of only five equations and eight parameters, was identified with and without intraday variance in insulin sensitivity (S(I)), glucose effectiveness at zero insulin (GEZI), and endogenous glucose production (EGP) at zero insulin.
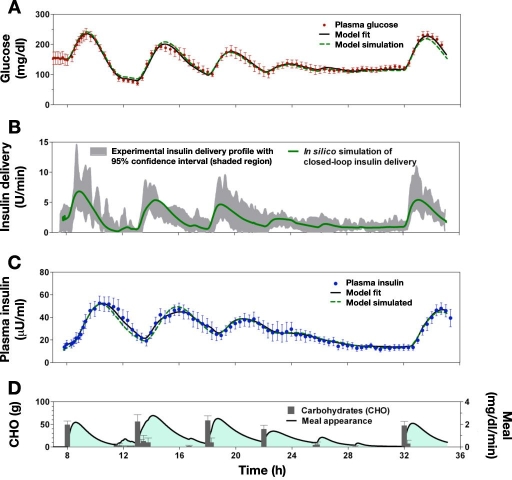
Results: Substantial intraday variation in SI, GEZI and EGP was observed in 7 of 10 subjects (root mean square error in model fit greater than 25 mg/dl with fixed parameters and nadir and/or peak glucose levels differing more than 25 mg/dl from model predictions). With intraday variation in these three parameters, plasma glucose and insulin were well fit by the model (R(2) = 0.933 +/- 0.00971 [mean +/- standard error of the mean] ranging from 0.879-0.974 for glucose; R(2) = 0.879 +/- 0.0151, range 0.819-0.972 for insulin). Once subject parameters were identified, the original study could be reconstructed using only the initial glucose value and basal insulin rate at the time closed loop was initiated together with meal carbohydrate information (glucose, R(2) = 0.900 +/- 0.015; insulin delivery, R(2) = 0.640 +/- 0.034; and insulin concentration, R(2) = 0.717 +/- 0.041).
Conclusion: Metabolic models used in developing and comparing closed-loop insulin delivery algorithms will need to explicitly describe intraday variation in metabolic parameters, but the model itself need not be comprised by a large number of compartments or differential equations.
2009 Diabetes Technology Society.
Figures
References
-
- Juvenile Diabetes Research Foundation Continuous Glucose Monitoring Study Group. Tamborlane WV, Beck RW, Bode BW, Buckingham B, Chase HP, Clemons R, Fiallo-Scharer R, Fox LA, Gilliam LK, Hirsch IB, Huang ES, Kollman C, Kowalski AJ, Laffel L, Lawrence JM, Lee J, Mauras N, O'Grady M, Ruedy KJ, Tansey M, Tsalikian E, Weinzimer S, Wilson DM, Wolpert H, Wysocki T, Xing D. Continuous glucose monitoring and intensive treatment of type 1 diabetes. N Engl J Med. 2008;359(14):1464–1476. - PubMed
-
- Steil GM, Clark B, Kanderian S, Rebrin K. Modeling insulin action for development of a closed-loop artificial pancreas. Diabetes Technol Ther. 2005;7(1):94–108. - PubMed
-
- Hovorka R, Chassin LJ, Ellmerer M, Plank J, Wilinska ME. A simulation model of glucose regulation in the critically ill. Physiol Meas. 2008;29(8):959–978. - PubMed
-
- Steil GM, Rebrin K, Darwin C, Hariri F, Saad MF. Feasibility of automating insulin delivery for the treatment of type 1 diabetes. Diabetes. 2006;55(12):3344–3350. - PubMed
Publication types
MeSH terms
Substances
Grants and funding
LinkOut - more resources
Full Text Sources
Other Literature Sources
Medical
