

Overnight closed-loop insulin delivery with model predictive control: assessment of hypoglycemia and hyperglycemia risk using simulation studies
- PMID: 20144424
- PMCID: PMC2769888
- DOI: 10.1177/193229680900300514
Overnight closed-loop insulin delivery with model predictive control: assessment of hypoglycemia and hyperglycemia risk using simulation studies
Abstract
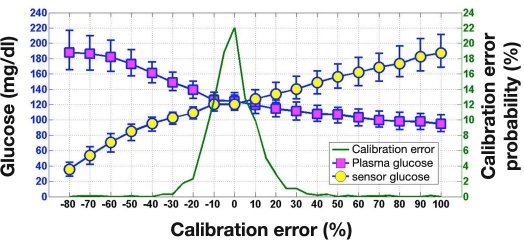
Background: Hypoglycemia and hyperglycemia during closed-loop insulin delivery based on subcutaneous (SC) glucose sensing may arise due to (1) overdosing and underdosing of insulin by control algorithm and (2) difference between plasma glucose (PG) and sensor glucose, which may be transient (kinetics origin and sensor artifacts) or persistent (calibration error [CE]). Using in silico testing, we assessed hypoglycemia and hyperglycemia incidence during over-night closed loop. Additionally, a comparison was made against incidence observed experimentally during open-loop single-night in-clinic studies in young people with type 1 diabetes mellitus (T1DM) treated by continuous SC insulin infusion.
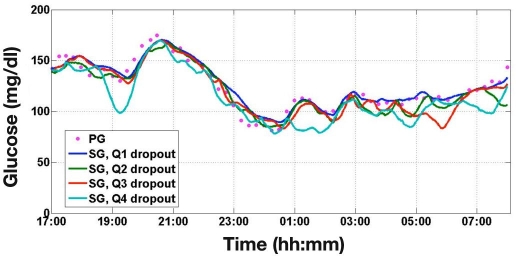
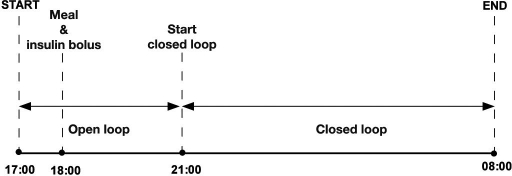
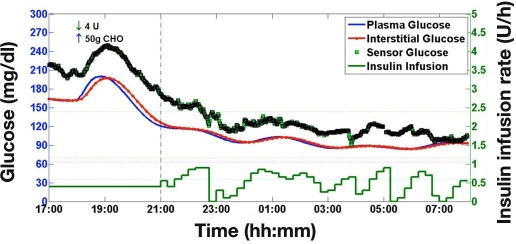
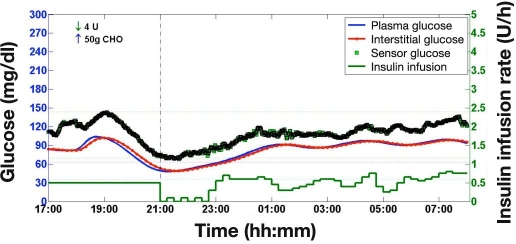
Methods: Simulation environment comprising 18 virtual subjects with T1DM was used to simulate overnight closed-loop study with a model predictive control (MPC) algorithm. A 15 h experiment started at 17:00 and ended at 08:00 the next day. Closed loop commenced at 21:00 and continued for 11 h. At 18:00, protocol included meal (50 g carbohydrates) accompanied by prandial insulin. The MPC algorithm advised on insulin infusion every 15 min. Sensor glucose was obtained by combining model-calculated noise-free interstitial glucose with experimentally derived transient and persistent sensor artifacts associated with FreeStyle Navigator (FSN). Transient artifacts were obtained from FSN sensor pairs worn by 58 subjects with T1DM over 194 nighttime periods. Persistent difference due to FSN CE was quantified from 585 FSN sensor insertions, yielding 1421 calibration sessions from 248 subjects with diabetes.
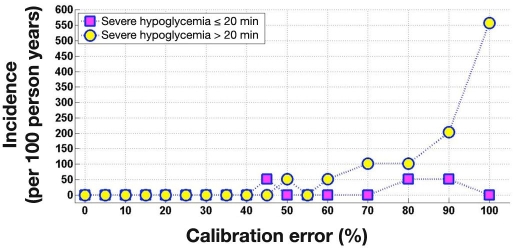
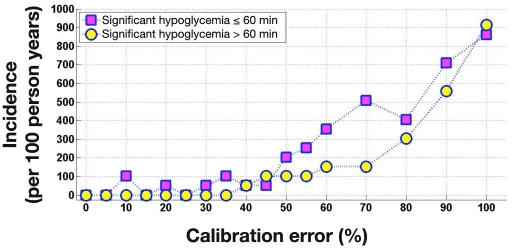
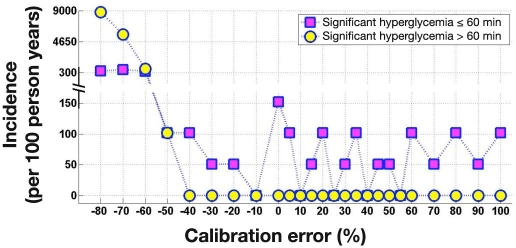
Results: Episodes of severe (PG < or = 36 mg/dl) and significant (PG < or = 45 mg/dl) hypoglycemia and significant hyperglycemia (PG > or = 300 mg/dl) were extracted from 18,000 simulated closed-loop nights. Severe hypoglycemia was not observed when FSN CE was less than 45%. Hypoglycemia and hyperglycemia incidence during open loop was assessed from 21 overnight studies in 17 young subjects with T1DM (8 males; 13.5 +/- 3.6 years of age; body mass index 21.0 +/- 4.0 kg/m2; duration diabetes 6.4 +/- 4.1 years; hemoglobin A1c 8.5% +/- 1.8%; mean +/- standard deviation) participating in the Artificial Pancreas Project at Cambridge. Severe and significant hypoglycemia during simulated closed loop occurred 0.75 and 17.11 times per 100 person years compared to 1739 and 3479 times per 100 person years during experimental open loop, respectively. Significant hyperglycemia during closed loop and open loop occurred 75 and 15,654 times per 100 person years, respectively.
Conclusions: The incidence of severe and significant hypoglycemia reduced 2300- and 200-fold, respectively, during stimulated overnight closed loop with MPC compared to that observed during open-loop overnight clinical studies in young subjects with T1DM. Hyperglycemia was 200 times less likely. Overnight closed loop with the FSN and the MPC algorithm is expected to reduce substantially the risk of hypoglycemia and hyperglycemia.
2009 Diabetes Technology Society.
Figures

References
-
- Klonoff DC. Continuous glucose monitoring: roadmap for 21st century diabetes therapy. Diabetes Care. 2005;28(5):1231–1239. - PubMed
-
- Hovorka R. Continuous glucose monitoring and closed-loop systems. Diabet Med. 2006;23(1):1–12. - PubMed
-
- Steil GM, Rebrin K. Closed-loop insulin delivery—what lies between where we are and where we are going? Expert Opin Drug Deliv. 2005;2(2):353–362. - PubMed
-
- Shalitin S, Phillip M. Closing the loop: combining insulin pumps and glucose sensors in children with type 1 diabetes mellitus. Pediatr Diabetes. 2006;7(Suppl 4):45–49. - PubMed
Publication types
MeSH terms
Substances
Grants and funding
LinkOut - more resources
Full Text Sources
Other Literature Sources
Medical
