

New approaches to display of self-monitoring of blood glucose data
- PMID: 20144425
- PMCID: PMC2769916
- DOI: 10.1177/193229680900300515
New approaches to display of self-monitoring of blood glucose data
Abstract
Background: There is a need for improved methods for display and analysis of self-monitoring of blood glucose (SMBG) data to facilitate identification of clinical problems, assist the clinician in the interpretation of daily patterns and longitudinal trends, serve as a guide to locating the most important segments of logbook data, and permit rapid analysis of the patient's pattern of glucose monitoring.
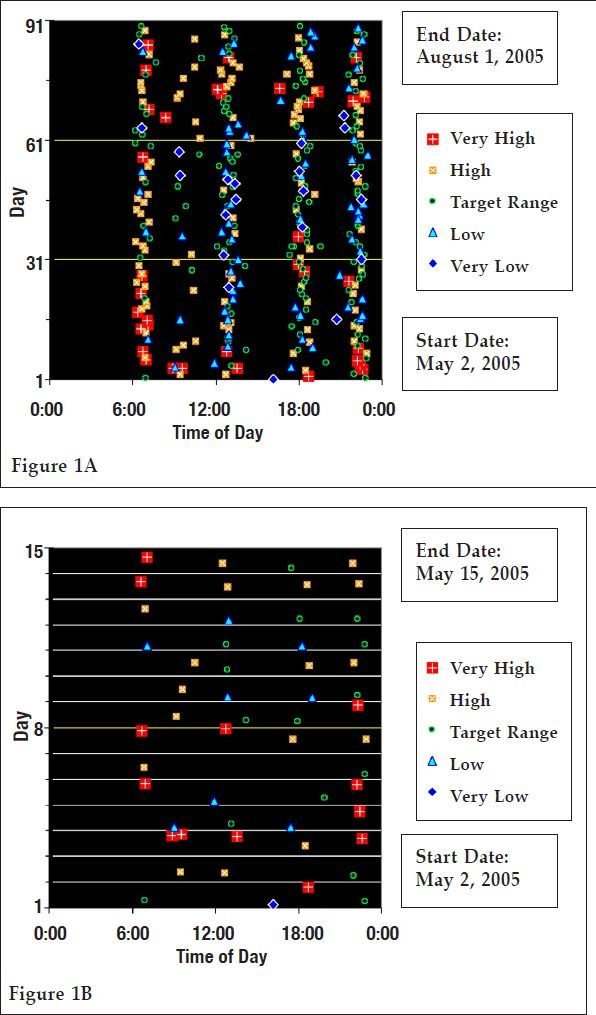
Methods: We developed prototype software to display SMBG data in a two-dimensional color-coded array: Time of day is displayed on the horizontal axis; date or sequential day is displayed on the vertical axis. Each glucose value is shown by a color-coded symbol categorizing it as "very high," "high," "within target range," "low," or "very low." The number of categories and their ranges can be defined by the user, and different target ranges and limits for the categories can be used for different times of day. Placing the cursor over any observation activates a "pop-up box" showing the date, day of week, time of day, glucose value, and ancillary information. Several options and variations are available.
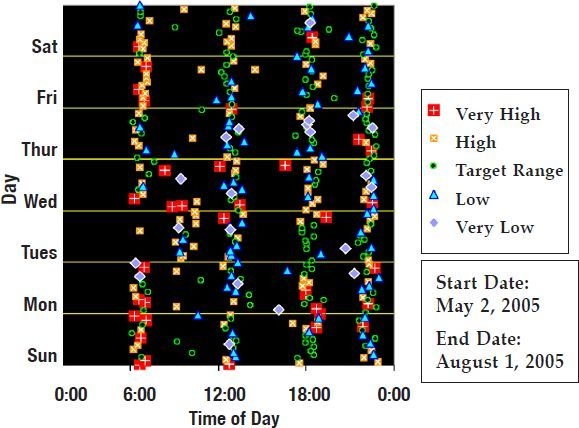
Results: This new type of display is compact, serves as a guide to assist the physician in locating the most important segments of the logbook, and permits display of glucose data from 90 or more days in a chart as small as 4 by 4 inches. This analysis permits rapid identification of measurements that are above or below the target range and facilitates rapid evaluation of patterns observed on different days or days of the week.
Conclusion: These new approaches complement other popular graphical displays by conveying information efficiently and effectively to the physician, other health care providers, the patient, and family caregivers in a new and novel, concise, standardized yet flexible format.
2009 Diabetes Technology Society.
Figures
Similar articles
-
Approaches to display of multiple-point glucose profiles: A UK patient's perspective.J Diabetes Sci Technol. 2014 Nov;8(6):1233-8. doi: 10.1177/1932296814541245. Epub 2014 Jul 2. J Diabetes Sci Technol. 2014. PMID: 25355715 Free PMC article. Review.
-
A semilogarithmic scale for glucose provides a balanced view of hyperglycemia and hypoglycemia.J Diabetes Sci Technol. 2009 Nov 1;3(6):1395-401. doi: 10.1177/193229680900300620. J Diabetes Sci Technol. 2009. PMID: 20144394 Free PMC article.
-
Display of glucose distributions by date, time of day, and day of week: new and improved methods.J Diabetes Sci Technol. 2009 Nov 1;3(6):1388-94. doi: 10.1177/193229680900300619. J Diabetes Sci Technol. 2009. PMID: 20144393 Free PMC article.
-
A signal processing application for evaluating self-monitoring blood glucose strategies in a software agent model.Comput Methods Programs Biomed. 2015 Jul;120(2):77-87. doi: 10.1016/j.cmpb.2015.04.008. Epub 2015 Apr 25. Comput Methods Programs Biomed. 2015. PMID: 25960316
-
Delays in minimally invasive continuous glucose monitoring devices: a review of current technology.J Diabetes Sci Technol. 2009 Sep 1;3(5):1207-14. doi: 10.1177/193229680900300528. J Diabetes Sci Technol. 2009. PMID: 20144438 Free PMC article. Review.
Cited by
-
Approaches to display of multiple-point glucose profiles: A UK patient's perspective.J Diabetes Sci Technol. 2014 Nov;8(6):1233-8. doi: 10.1177/1932296814541245. Epub 2014 Jul 2. J Diabetes Sci Technol. 2014. PMID: 25355715 Free PMC article. Review.
-
A semilogarithmic scale for glucose provides a balanced view of hyperglycemia and hypoglycemia.J Diabetes Sci Technol. 2009 Nov 1;3(6):1395-401. doi: 10.1177/193229680900300620. J Diabetes Sci Technol. 2009. PMID: 20144394 Free PMC article.
-
How Knowledge Emerges From Artificial Intelligence Algorithm and Data Visualization for Diabetes Management.J Diabetes Sci Technol. 2019 Jul;13(4):698-707. doi: 10.1177/1932296819847739. Epub 2019 May 21. J Diabetes Sci Technol. 2019. PMID: 31113239 Free PMC article.
-
Display of glucose distributions by date, time of day, and day of week: new and improved methods.J Diabetes Sci Technol. 2009 Nov 1;3(6):1388-94. doi: 10.1177/193229680900300619. J Diabetes Sci Technol. 2009. PMID: 20144393 Free PMC article.
-
Design of a decision support system to help clinicians manage glycemia in patients with type 2 diabetes mellitus.J Diabetes Sci Technol. 2011 Mar 1;5(2):402-11. doi: 10.1177/193229681100500230. J Diabetes Sci Technol. 2011. PMID: 21527112 Free PMC article.
References
-
- Blonde L, Karter AJ. Current evidence regarding the value of self-monitored blood glucose testing. Am J Med. 2005 Sep;118(Suppl 9A):20S–26S. - PubMed
-
- Saudek CD, Derr RL, Kalyani RR. Assessing glycemia in diabetes using self-monitoring blood glucose and hemoglobin A1c. JAMA. 2006 Apr 12;295(14):1688–1697. - PubMed
-
- Pernick NL, Rodbard D. Personal computer programs to assist with self-monitoring of blood glucose and self-adjustment of insulin dosage. Diabetes Care. 1986 Jan–Feb;9(1):61–69. - PubMed
-
- Rodbard D. Potential role of computers in clinical investigation and management of diabetes mellitus. Diabetes Care. 1988 Nov–Dec;11(Suppl 1):54–61. - PubMed
MeSH terms
Substances
LinkOut - more resources
Full Text Sources
Other Literature Sources
Medical
