. 2010 Feb 5;6(2):141-52.
doi: 10.1016/j.stem.2010.01.001.

Perivascular nitric oxide activates notch signaling and promotes stem-like character in PDGF-induced glioma cells

Affiliations

Perivascular nitric oxide activates notch signaling and promotes stem-like character in PDGF-induced glioma cells

Nikki Charles et al. Cell Stem Cell. .

Abstract

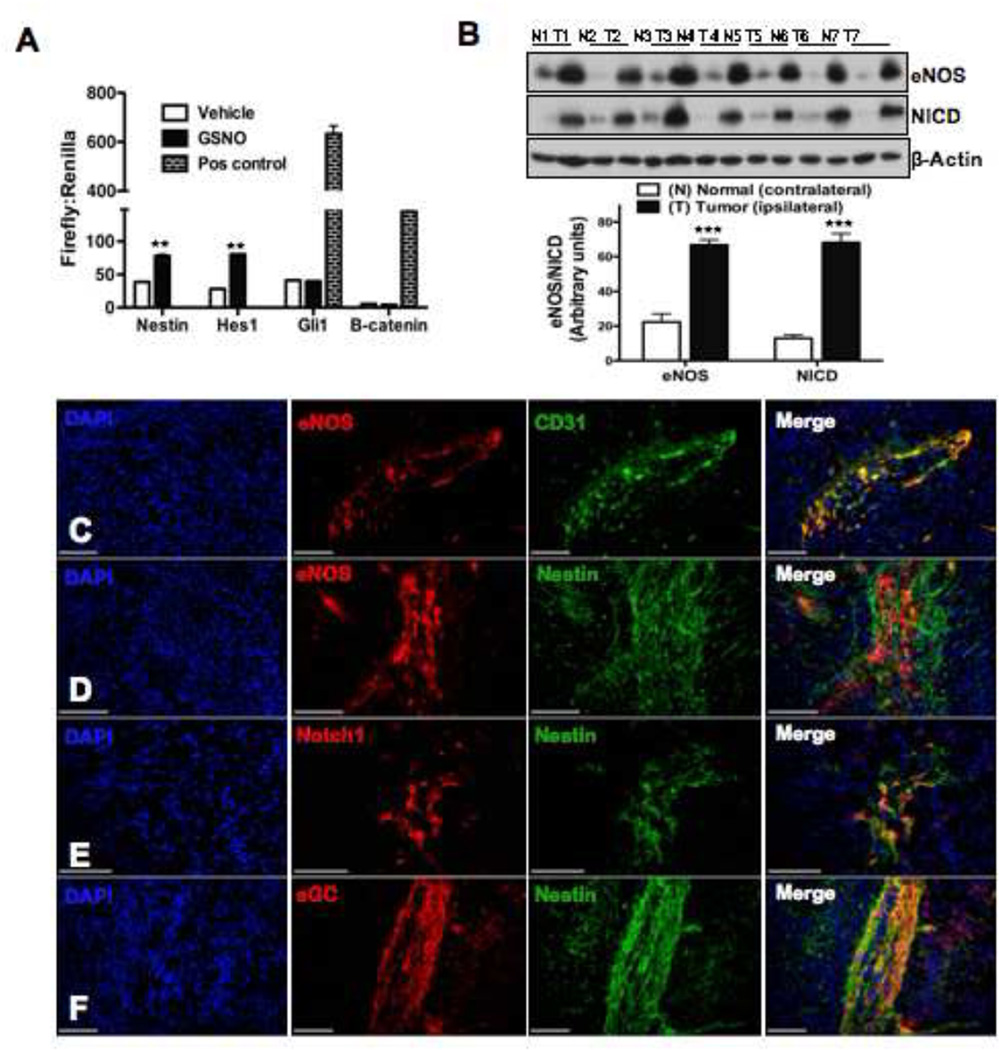
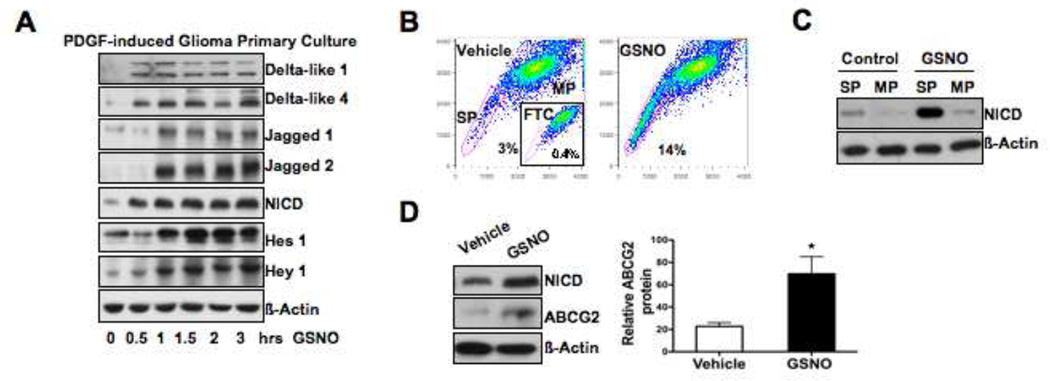
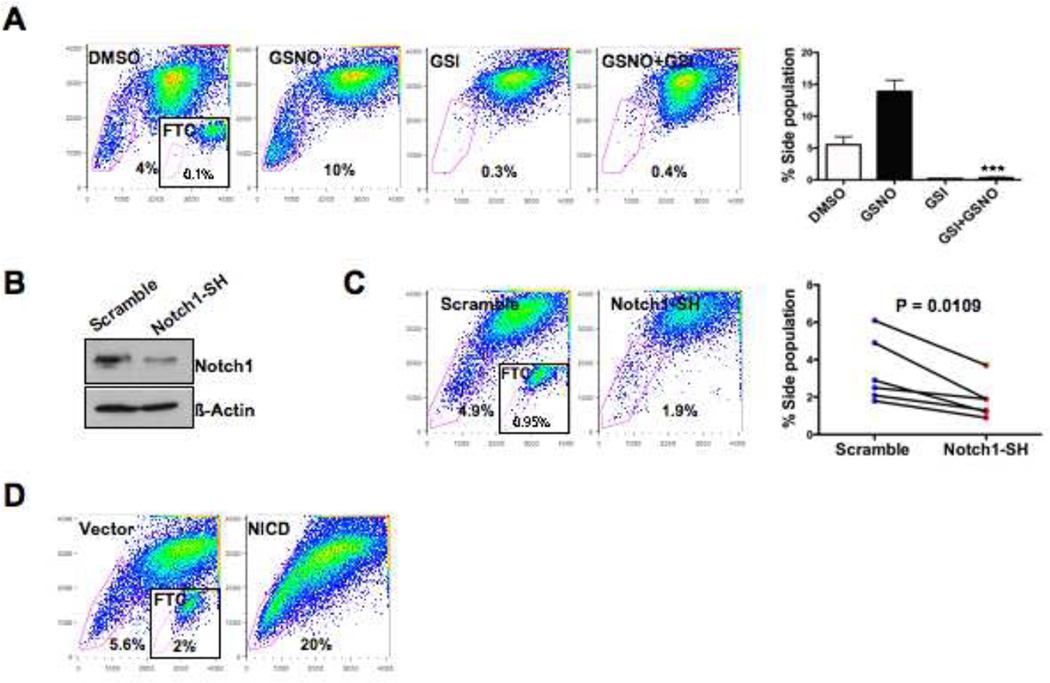
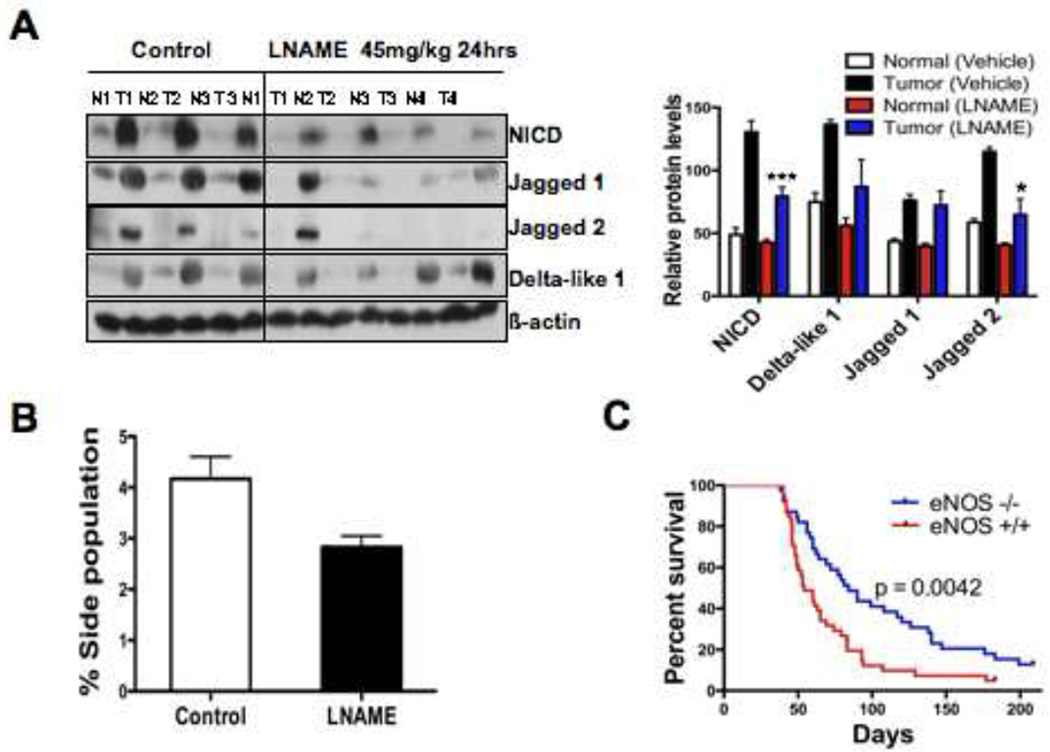
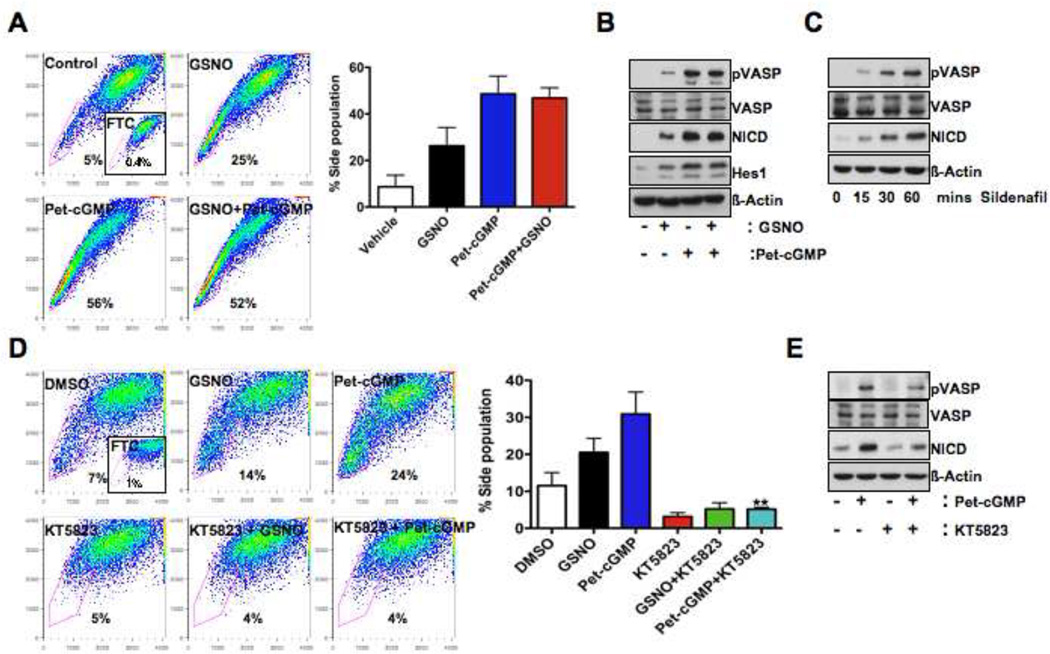
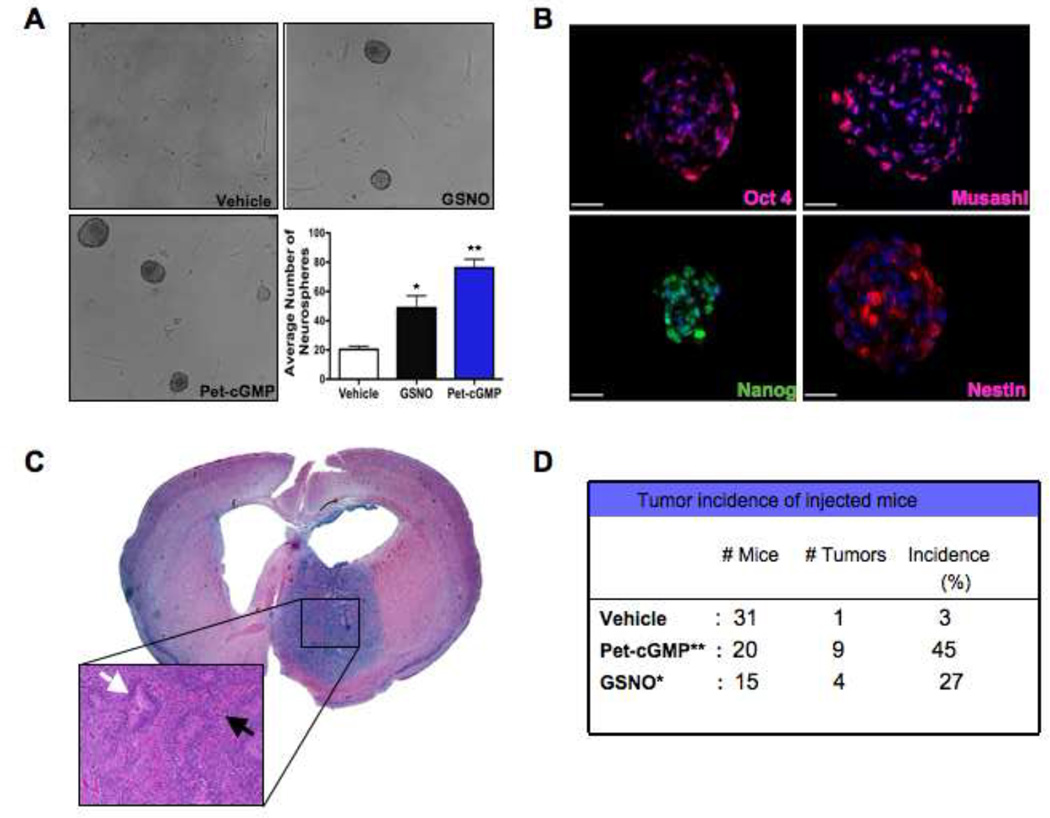
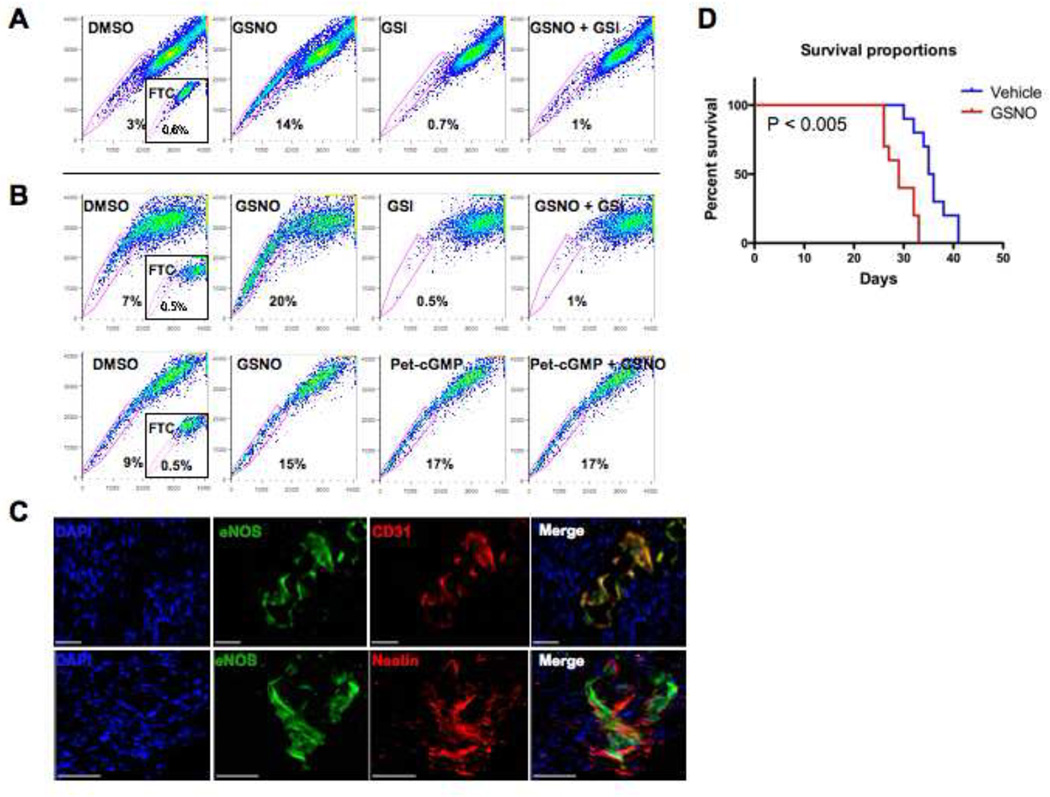
eNOS expression is elevated in human glioblastomas and correlated with increased tumor growth and aggressive character. We investigated the potential role of nitric oxide (NO) activity in the perivascular niche (PVN) using a genetic engineered mouse model of PDGF-induced gliomas. eNOS expression is highly elevated in tumor vascular endothelium adjacent to perivascular glioma cells expressing Nestin, Notch, and the NO receptor, sGC. In addition, the NO/cGMP/PKG pathway drives Notch signaling in PDGF-induced gliomas in vitro, and induces the side population phenotype in primary glioma cell cultures. NO also increases neurosphere forming capacity of PDGF-driven glioma primary cultures, and enhances their tumorigenic capacity in vivo. Loss of NO activity in these tumors suppresses Notch signaling in vivo and prolongs survival of mice. This mechanism is conserved in human PDGFR amplified gliomas. The NO/cGMP/PKG pathway's promotion of stem cell-like character in the tumor PVN may identify therapeutic targets for this subset of gliomas.


Figures

Figure 1
Figure 1. Nitric oxide stimulates Nestin and Hes1 promoter activity in human glioma cells and elevated eNOS and Notch1 protein expression is localized to cells of the glioma perivascular niche (PVN)
(A) Luciferase assay of U251 glioma cells transfected with Hes1, Nestin, Gli1 or β-Catenin responsive luciferase reporters. Positive controls for Gli and Wnt reporters were co-transfections of CMVgli or CMV-beta-Catenin expressing vectors respectively ( **p < 0.005, reports difference between Nestin and Hes1 promoter activity in control and GSNO treated U251 cells). (B) Western blot analysis of PDGFinduced mouse gliomas analyzed for total eNOS and Notch intracellular domain (NICD) proteins (N=7). N and T represent the contralateral normal and tumor containing hemispheres of the brain respectively. Bottom: Quantification of eNOS and NICD proteins. Data are represented as mean +/− SEM. (***p < 0.005, reports difference between the contralateral normal and tumor containing hemispheres). (C-F) Co-immmunofluorescence in mouse PDGF-induced gliomas of eNOS, Notch1, sGC (red) and CD31 and Nestin (green) expression. All nuclei are stained with DAPI. All scale bars 75µm.
Figure 2
Figure 2. NO activates Notch signaling and the SP phenotype in PDGF-induced glioma primary cultures (PIGPCs)
(A) PIGPC treated with GSNO (100µM) for the indicated times (N = 6). (B) SP analysis of GSNO treated PIGPC. Inset shows cells treated with FTC (fumitremorgen C - an ABCG2 inhibitor). SP (side population); MP (main population). Data shows one representative graph of 4 independent experiments. (C) GSNO treated PIGPCs, sorted for their SP and MP, then analyzed by Western blot for expression of NICD with respect to vehicle treated controls. (D) (Left) Western blot analysis of whole cell lysates from PIGPC treated with GSNO or vehicle and probed for NICD, ABCG2 and β-actin proteins. (right) Quantification of ABCG2 proteins using ImageJ software. Data are represented as mean +/−SEM of three individual experiments (*p < 0.05 compared with control).
Figure 3
Figure 3. Notch signaling is required for Nitric oxide enhancement of the SP phenotype
(A) (Left) SP analysis of GSNO (100µM) and GSI (3µM) treated PIGPCs. Inset shows cells treated with FTC control. (Right) Bar chart shows quantification of SP analyzed data on the left. Data are represented as mean +/−SEM of three individual experiments. (***p < 0.0005 compared with GSNO treatment). (B) Western Blot to confirm knockdown of Notch1 proteins. (C) (Left) SP analysis shows a decrease in the percent of SP cells by Notch1-sh-RNA (Notch1-SH) relative to nonspecific scramble control. Inset shows, a negative control, FTC. Graph represents one of six independent PIGPCs samples. (Right) Quantification of Notch1-shRNA mediated knockdown of the SP in 6 independent PIGPCs. (D) SP analysis of PIGPCs infected with empty vector or vector expressing constitutively active Notch (NICD). Inset shows cells treated with FTC.
Figure 4
Figure 4. Suppression of NO activity in vivo decreases Notch signaling and the SP phenotype and enhances survival in vivo
(A) Western blot on whole cell lysates of PDGF-induced gliomas derived from vehicle (water) or LNAME (45mg/kg; 24hrs) treated mice using NICD, Jagged 1 and 2 and Delta-like 1 antibodies. N-represents the contralateral non-tumor hemisphere of mouse brain. T-represents the tumor-bearing portion of mouse brain. Vehicle (N=3); LNAME (N=4). Bar chart represents quantification of proteins analyzed on the left using ImageJ software. (*p < 0.05, ***p < 0.0005 reports the difference between NICD and Jagged 2 in vehicle and LNAME treated PDGF-induced gliomas). (B) Bar chart shows that suppression of NO activity in vivo decreases the SP phenotype in PDGF-induced gliomas (*p < 0.05 reports the difference between vehicle (N=6) and LNAME (N=6) treated groups). (C) Kaplan- Meier survival curve shows loss of eNOS expression in PDGF-induced gliomas prolongs survival of mice (eNOS+/+ N=41; eNOS−/− N=42).
Figure 5
Figure 5. Nitric oxide induces the SP phenotype through cGMP activation of PKG
(A) (Left) SP analysis of GSNO (100µM) and Pet-cGMP (200µM) treated PIGPCs. Inset shows cells treated with FTC. (Right) Quantification of SP analysis on the left. Data represented as mean +/−SEM of three individual experiments. (B) Western blot analysis on whole cell lysates of PIGPC analyzed in A and probed with pVASP, VASP (vasodilator stimulated phospho protein), NICD, Hes1 and β-actin antibodies. (C) Western blot analysis on whole cell lysates of PIGPC treated with sildenafil (1µM) for the indicated times and probed with pVASP, VASP, NICD and β-actin antibodies. (D) (Left) SP analysis on PIGPC treated with GSNO, Pet-cGMP and the PKG inhibitor KT5823 (3µM). (Right) Quantification of SP analysis on the left (**p < 0.005, reports the difference between Pet-cGMP alone and in the presence of KT5823). (E) Western blot analysis on whole cell lysates of PIGPC analyzed in D and probed with pVASP, VASP, NICD and β-actin antibodies.
Figure 6
Figure 6. Enhanced NO/cGMP signaling promotes the neural stem cell forming capacity of PDGF-induced gliomas and enhances tumorigenicity
(A) PIGPCs pretreated with vehicle, GSNO or Pet-cGMP for 2.5 hours then placed in NSC (neural stem cell) medium. Micrographs show NSC formation after 2 weeks. (Lower right) Bar chart represents quantification of number of neurospheres shown above, as an average of three experiments performed in duplicate (*p < 0.05, **p < 0.01 reports the difference between vehicle treated controls and GSNO or petcGMP treatments respectively). (B) Oct-4, musashi, nanog and Nestin immunofluorescence on NSCs generated in A. Scale bars 40µm. (C) Representative whole mount H&E of tumors generated from PetcGMP treated PIGPC. Arrows indicate high-grade features such as, pseudopalisades (white arrow) and microvascular proliferation (black arrow). (D) A comparison of tumor incidence between vehicle (water), Pet-cGMP and GSNO treated primary glioma cells (Fisher’s exact test; *p = 0.033 and **p = 0.0004 reports the difference between vehicle treated controls and GSNO and pet-cGMP treatments respectively).
Figure 7
Figure 7. NO enhances the SP phenotype in human glioma cells and decreases survival
(A) SP analysis of GSNO and GSI treated T98G human glioma cell line. Inset shows cells treated with FTC. (B) (Above) SP analysis of GSNO (35µM) and GSI (3µM) treated human tumor neurospheres. (Below) SP analysis of GSNO and Pet-cGMP (80µM) treated human tumor neurospheres. Inset shows cells treated with FTC. Plots represent one of three experiments. (C) Co-immmunofluorescence on PDGFR-amplified human gliomas to detect eNOS (green), CD31 and Nestin (red) protein expression. All nuclei are stained with DAPI. All scale bars 75µm. (D) Kaplan-Meier survival curve shows GSNO activated human glioma primary neurosphere cultures, shortens the survival of mice. Median survival of vehicle and GSNO treated human primary glioma cultures was 36 and 29 days respectively (N=10).

Comment in

Similar articles

Cited by

References

    1. Bakshi A, Nag TC, Wadhwa S, Mahapatra AK, Sarkar C. The expression of nitric oxide synthases in human brain tumours and peritumoral areas. J Neurol Sci. 1998;155(2):196–203. - PubMed
    1. Becher OJ, Hambardzumyan D, Fomchenko EI, Momota H, Mainwaring L, Bleau AM, Katz AM, Edgar M, Kenney AM, Cordon-Cardo C, et al. Gli activity correlates with tumor grade in platelet-derived growth factor-induced gliomas. Cancer Res. 2008;68(7):2241–2249. - PubMed
    1. Bender AT, Beavo JA. Cyclic nucleotide phosphodiesterases: molecular regulation to clinical use. Pharmacol Rev. 2006;58(3):488–520. - PubMed
    1. Blaise GA, Gauvin D, Gangal M, Authier S. Nitric oxide, cell signaling and cell death. Toxicology. 2005;208(2):177–192. - PubMed
    1. Bleau AM, Hambardzumyan D, Ozawa T, Fomchenko EI, Huse JT, Brennan CW, Holland EC. PTEN/PI3K/Akt pathway regulates the side population phenotype and ABCG2 activity in glioma tumor stem-like cells. Cell Stem Cell. 2009;4(3):226–235. - PMC - PubMed

Publication types

MeSH terms

LinkOut - more resources