. 2010 Jun;38(10):3466-76.
doi: 10.1093/nar/gkq053. Epub 2010 Feb 9.

Structural determinants of specific DNA-recognition by the THAP zinc finger

Affiliations

Structural determinants of specific DNA-recognition by the THAP zinc finger

Sébastien Campagne et al. Nucleic Acids Res. 2010 Jun.

Abstract

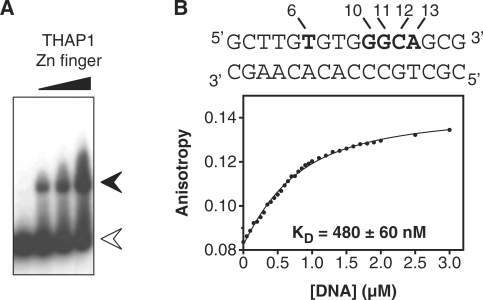
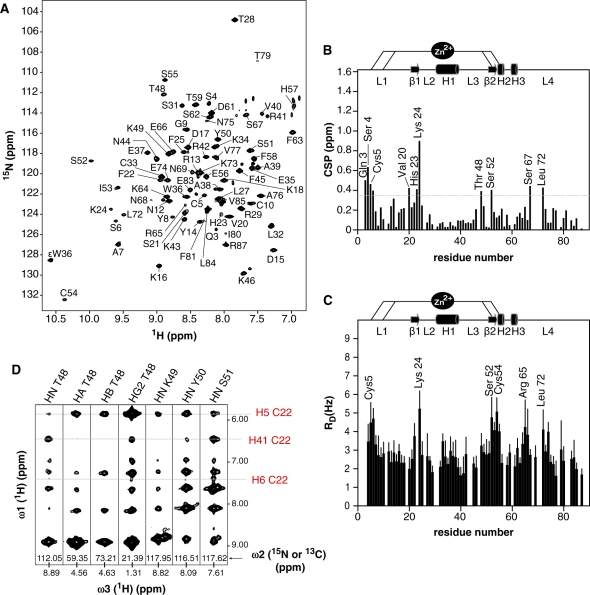
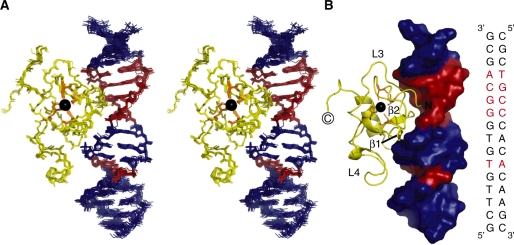
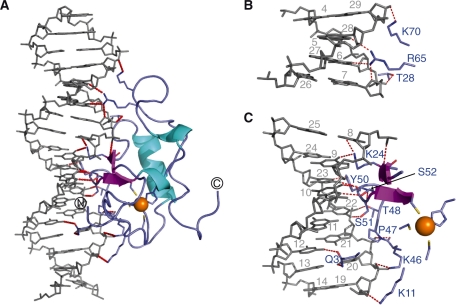
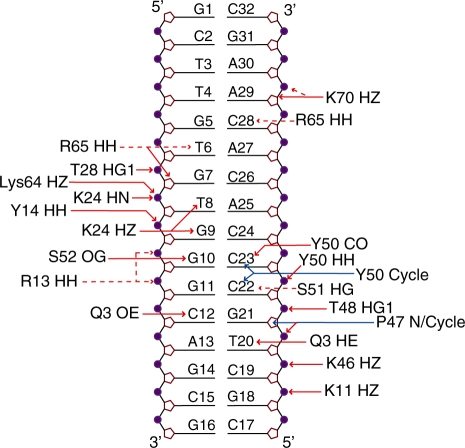
Human THAP1 is the prototype of a large family of cellular factors sharing an original THAP zinc-finger motif responsible for DNA binding. Human THAP1 regulates endothelial cell proliferation and G1/S cell-cycle progression, through modulation of pRb/E2F cell-cycle target genes including rrm1. Recently, mutations in THAP1 have been found to cause DYT6 primary torsion dystonia, a human neurological disease. We report here the first 3D structure of the complex formed by the DNA-binding domain of THAP1 and its specific DNA target (THABS) found within the rrm1 target gene. The THAP zinc finger uses its double-stranded beta-sheet to fill the DNA major groove and provides a unique combination of contacts from the beta-sheet, the N-terminal tail and surrounding loops toward the five invariant base pairs of the THABS sequence. Our studies reveal unprecedented insights into the specific DNA recognition mechanisms within this large family of proteins controlling cell proliferation, cell cycle and pluripotency.


Figures

Figure 1.
Figure 1.
The rrm1-DNA binding of the THAP zinc finger of hTHAP1 observed by EMSA and fluorescence anisotropy. (A) EMSA experiments were performed using a 16-bp oligonucleotide found in the rrm1 DNA target and increasing amounts (1, 2.5 and 5 µM) of the recombinant THAP zinc finger of THAP1. White arrow, free rrm1 and black arrow, rrm1-THAP zinc-finger complex (B) top, sequence of the 16-bp rrm1 oligonucleotide. Invariant bases of the THABS core motif are highlighted in bold bottom, plot showing the fluorescence anisotropy of the single tryptophan residue (Trp36) as a function of increased DNA concentrations. The protein concentration was 0.5 µM and the DNA concentration ranged from 0 to 3 µM.
Figure 2.
Figure 2.
The rrm1-DNA binding of the THAP zinc finger of hTHAP1 observed by NMR. (A) The 1H-15N HSQC spectrum of the THAP zinc finger in the presence of an equimolar amount of the 16-bp rrm1 DNA. (B) Histogram of chemical shift changes upon DNA binding as a function of the residue number. Reported chemical shift changes represent combined 15N and 1H chemical shift changes as (Δδ = [(ΔδHN)2 +(ΔδN × 0.154)2]½). Secondary structure elements are shown above the panel. (C) Plot showing reduction rates of peak intensities as function of residue number upon saturation of the DNA imino proton resonances (cross-saturation experiments). The peak intensities were extracted from 2D 1H-15N HSQC spectra recorded with different saturation periods up to 1.8 s. (D) Strip views extracted from 3D 15N and 13C NOESY spectra showing selected intermolecular NOEs observed between the doubly 15N, 13C-labeled THAP zinc finger of hTHAP1 and unlabeled rrm1-DNA.
Figure 3.
Figure 3.
The NMR solution structure of the complex between the THAP zinc finger of hTHAP1 and its specific rrm1 DNA target. (A) Stereo-view of the NMR ensemble for the 15 lowest energy structures. Colour code: protein, yellow and DNA, blue and red. The five invariant base pairs of the DNA THABS core motif are coloured red. The zinc atom is shown in black and the four ligands are depicted in orange. (B) Ribbon diagram of the protein bound to the DNA molecular surface with the same orientation as in (A). For clarity, some secondary structure elements are indicated on the protein ribbon. The sequence of the 16-bp rrm1 oligonucleotide is shown in the right panel. The five invariant base pairs of the DNA THABS core motif are highlighted in red.
Figure 4.
Figure 4.
DNA recognition by the THAP zinc finger (A) Ribbon representation indicating the polar contacts (red dotted lines) observed at the DNA–protein interface. DNA is shown in grey and the protein is coloured blue with the exception of the β-strands and the helices, which are coloured magenta and cyan, respectively. The zinc ion is depicted in orange. The four zinc ligands together with the amino acid side chains at the DNA–protein interface are shown as sticks. (B) Close-up view of the minor groove interface with the same orientation as in (A). (C) Close-up view of the major groove interface with the same orientation as in (A).
Figure 5.
Figure 5.
Schematic representation illustrating the protein–DNA contacts in the structure of the rrm1-THAP zinc-finger complex. Red and blue arrows indicate hydrogen bonds and hydrophobic contacts, respectively. A hydrogen bond is considered to occur when potential donor and acceptor are <2.5 Å apart. Dotted red arrows indicate polar contacts observed between potential donors and acceptors that do not satisfy the hydrogen bond distance criteria. The plot was generated by NucPlot (46). The contacts represented here are summarized in Supplementary Tables S2 and S3.
Figure 6.
Figure 6.
Structural and dynamic modifications of the THAP zinc finger of hTHAP1 upon DNA binding. (A) Expanded view showing superposition of the THAP zinc finger in its free state (blue) (Protein Data Bank entry 2jtg) (12), and in the presence of its specific DNA target (yellow). Loops L3 and L4, which undergo structural changes upon DNA binding, are indicated. (B) Histogram showing the heteronuclear NOE values for the protein in the absence (12) (blue) and in the presence of DNA (yellow) as a function of residue number. The secondary structure elements are depicted on the top.
Figure 7.
Figure 7.
Comparison of specific and non-specific recognition (A) Backbone amide nitrogen chemical shift perturbation upon addition of rrm1 specific (grey) and non-specific (black) DNA sequences. (B) Specific rrm1 and non-specific DNA sequences together with the respective binding affinity values are indicated. Measurements were performed at 30 mM NaCl.

References

    1. Jen-Jacobson L, Engler LE, Jacobson LA. Structural and thermodynamic strategies for site-specific DNA binding proteins. Structure. 2000;8:1015–1023. - PubMed
    1. Kalodimos CG, Biris N, Bonvin AM, Levandoski MM, Guennuegues M, Boelens R, Kaptein R. Structure and flexibility adaptation in nonspecific and specific protein-DNA complexes. Science. 2004;305:386–389. - PubMed
    1. Iwahara J, Zweckstetter M, Clore GM. NMR structural and kinetic characterization of a homeodomain diffusing and hopping on nonspecific DNA. Proc. Natl Acad. Sci. USA. 2006;103:15062–15067. - PMC - PubMed
    1. Schildbach JF, Karzai AW, Raumann BE, Sauer RT. Origins of DNA-binding specificity: role of protein contacts with the DNA backbone. Proc. Natl Acad. Sci. USA. 1999;96:811–817. - PMC - PubMed
    1. Luscombe NM, Laskowski RA, Thornton JM. Amino acid-base interactions: a three-dimensional analysis of protein-DNA interactions at an atomic level. Nucleic Acids Res. 2001;29:2860–2874. - PMC - PubMed

Publication types

Associated data