. 2010 Feb;8(2):145-58.
doi: 10.1158/1541-7786.MCR-09-0045. Epub 2010 Feb 9.

Urinary-type plasminogen activator receptor/alpha 3 beta 1 integrin signaling, altered gene expression, and oral tumor progression

Affiliations

Urinary-type plasminogen activator receptor/alpha 3 beta 1 integrin signaling, altered gene expression, and oral tumor progression

Supurna Ghosh et al. Mol Cancer Res. 2010 Feb.

Abstract

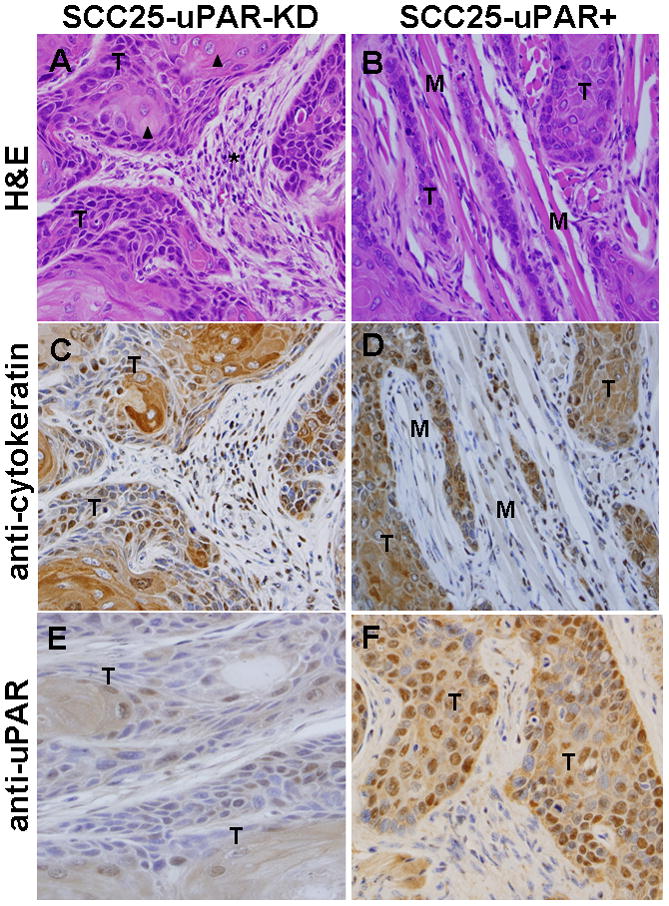
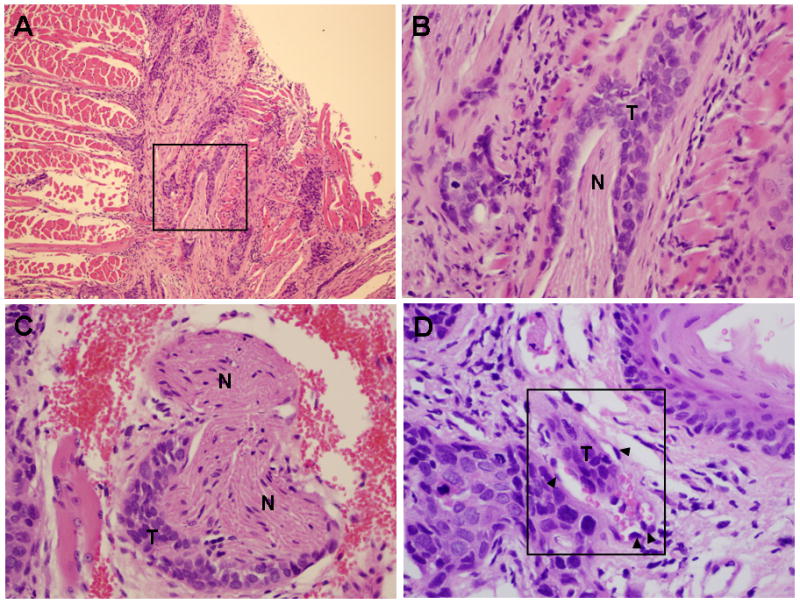
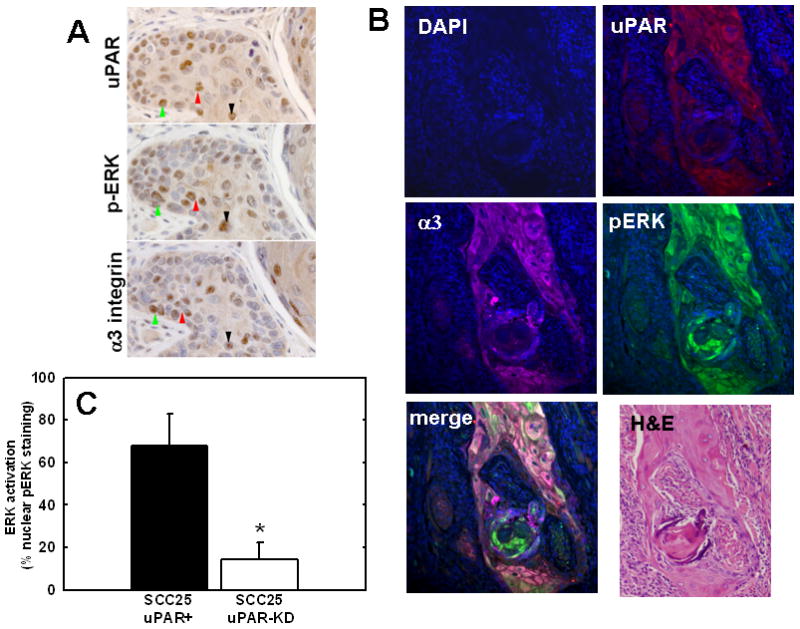
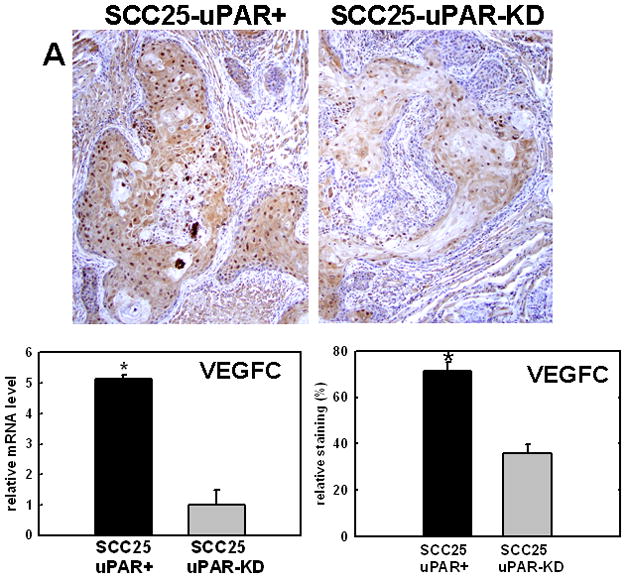
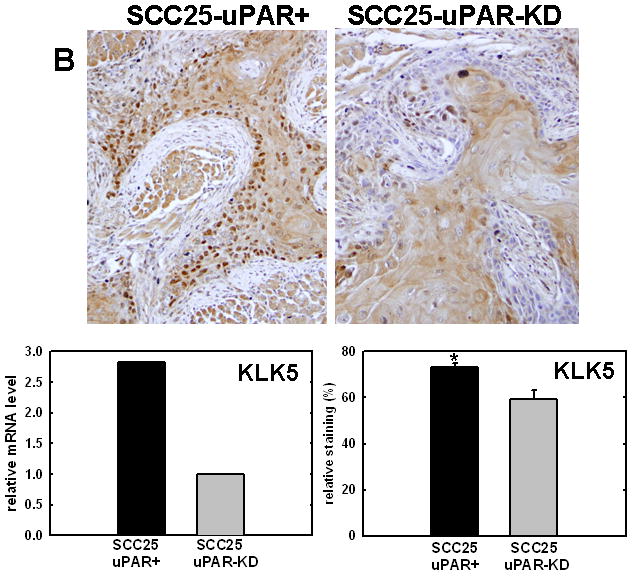
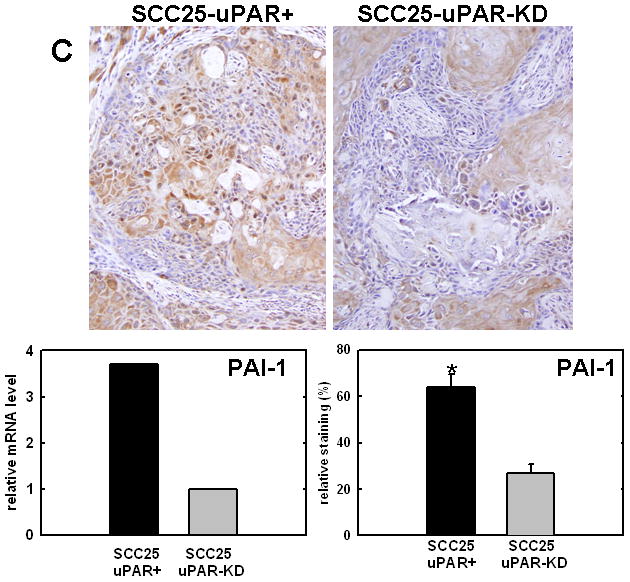
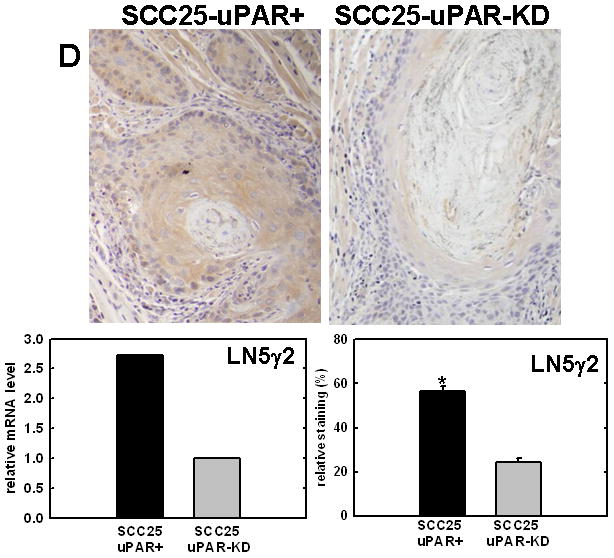
Oral squamous cell carcinoma (OSCC) has 50% 5-year survival rate, highlighting our limited understanding of the molecular events that contribute to disease progression. Microarray analyses of primary oral tumors have identified urinary-type plasminogen activator (uPA) and its receptor (uPAR) as key genes associated with human OSCC progression. The uPAR functions as both a proteinase receptor and an integrin ligand, modifying proteolysis, migration, integrin signaling, and cellular transcription. In the current study, uPAR expression levels were modified in OSCC cells followed by analysis of tumor growth in an in vivo orthotopic xenograft model and by transcriptional profiling. Overexpression of uPAR resulted in more infiltrative and less differentiated tumors, with ill-defined borders, cytologic atypia, and enhanced vascularity. Analysis of serial sections of both murine experimental tumors and microarrayed human OSCC showed a statistically significant association between uPAR and alpha(3) integrin colocalization in areas exhibiting extracellular signal-regulated kinase phosphorylation, suggesting that uPAR/alpha(3) integrin interaction potentiates extracellular signal-regulated kinase signaling in vivo. This is supported by cDNA microarray analysis, which showed differential expression of 148 genes (113 upregulated and 35 downregulated). Validation of gene expression changes in human OSCC using immunohistochemistry and quantitative real-time PCR showed increased growth factors, proteinases/inhibitors, and matrix components in uPAR-overexpressing tumors. Together, these results support a model wherein increased uPAR expression promotes alpha(3)beta(1) integrin association, resulting in increased mitogen-activated protein kinase signaling and transcriptional activation, leading to the formation of more aggressive tongue tumors. This combined approach has efficacy to identify additional biomarkers and/or prognostic indicators associated with aggressive human OSCC.


Figures

Figure 1
Figure 1. Histological and immunohistochemical examination of oral tongue tumors
Tumors generated from pooled clones of SCC25-uPAR-KD and SCC25-uPAR+ cells were (A,B) stained with H&E or immunostained with (C,D) anti-cytokeratin AE1/AE3 (1:25 dilution) or (E,F) anti-uPAR (1:25 dilution) followed by a biotinylated secondary antibody and detection of avidin-biotin with DAB chromagen and substrate as in Experimental Procedures. 400X magnification. (T) – designates areas of tumor cells; (M) designates host tongue muscle; (arrowheads) – focal keratinization (‘keratin pearls’ are highlighted); (arrows) – example of well-circumscribed tumor nests; (asterisk) – desmoplastic host response.
Figure 2
Figure 2. Perineural and vascular invasion in SCC-25-uPAR+ tumors
(A–C) Representative H&E sections showing tumor cords surrounding nerve bundle. (T) – tumor, (N) – nerve. Panel A – 100X magnification, panels B,C – 400X magnification. (D) Representative H&E section showing tumor localization within a small vessel (boxed area). Magnification 600X. (T) – tumor tissue; (arrowheads) – vascular endothelial cells. Note red blood cells also present in the vessel.
Figure 3
Figure 3. Co-localization of uPAR, α3 integrin and phospho-ERK immunostaining in murine tongue tumors
(A) Serial sections of tongue tumors generated from SCC25-uPAR+ cells were immunostained with anti-uPAR (3936 antibody, 1:25 dilution), anti-phospho-ERK (9101S antibody, 1:25 dilution) or anti-α3-integrin (1952 antibody, 1:25 dilution), as indicated, followed by biotinylated secondary antibody and detection as described in Experimental Procedures. 400X magnification. Colored arrows denote areas of co-localization of staining for activated (phospho-)-ERK in areas with prevalent uPAR and α3 integrin staining (brown stain). (B) Four color immunofluorescence analysis of uPAR, α3 integrin and phospho-ERK co-localization. Tumor sections were co-incubated with the primary antibodies goat anti-human uPAR (1:10 dilution), rabbit anti-phosphorylated ERK-1/2 (Thr202/Tyr204) (1:25 dilution), and mouse anti-α3 integrin (P1B5) (1:25 dilution) in blocking solution as described in Experimental Procedures, followed by fluophor-conjugated secondary antibodies (donkey anti-Goat IgG-Alexa Fluor-546, donkey anti-Rabbit IgG-Alexa Fluor-488, donkey anti-Mouse IgG-Alex Fluora-647, all from Invitrogen). Slides were mounted in DAPI-containing mounting medium. All stained slides were examined with an Olympus IX-80 with DSU spinning disk confocal system equipped with Hamamatsu EM-CCD camera ImagEM and the following 4 set of emission and excitation filters: for DAPI, D350/50x and ET455/50m (blue); for Alexa Fluor-488, 490/20x and ET525/36m(green); for Alexa Fluor-546, 555/25x and ET605/52m (red); and for Alexa Fluor-647 (magenta), 645/30x and ET705/72m. Image acquisition and normalization were all via the controlling software Slidebook 4.1 (Olympus). No additional image manipulations were performed. (C) Quantitation of active ERK (nuclear phospho-ERK) staining. Positive staining was evaluated by enumerating nuclei staining positively for nuclear phospho-ERK in a minimum of 85 distinct high powered tumor fields, and counting a minimum of 10,000 cells. ANOVA analysis demonstrates *p<.0001.
Figure 4
Figure 4. Validation of cDNA microarray results using immunohistochemical analysis of murine tongue tumors and qPCR
Representative sections from SCC25-uPAR+ or SCC25-uPAR-KD tumors were immunostained with (A) anti-VEGF-C (1:20 dilution), (B) anti-kallikrein-5 (1:25 dilution), (C) anti-PAI-1 (1:20 dilution) or (D) anti-laminin-γ2 chain (1:20 dilution) followed by biotinylated secondary antibody as in Experimental Procedures. 100X magnification. Corresponding qPCR analyses of gene expression in SCC25-uPAR+ and SCC25-uPAR-KD cell lines (left) and quantitation of immunohistochemical staining in murine tumors (right) are shown in the bar graphs. For qPCR, relative expression levels were normalized to housekeeping gene PGK. Each bar depicts the mean of replicate values expressed as fold-difference in mRNA level relative to SCC25-uPAR-KD cells (designated as 1, grey bars). (black bar) - SCC25-uPAR+, (grey bar) – SCC25-uPAR-KD. For quantitation of tumor staining, 2500–6000 cells from 10 tumor sections were scored and results are presented as relative staining (% of total cell number scored).

References

    1. Parkin DM, Pisani P, Ferlay J. Global cancer statistics. CA: A Cancer Journal for Clinicians. 1999:33–64. - PubMed
    1. Jemal A, Siegel R, Ward E, Murray T, Xu J, Smigal C, et al. Cancer statistics. CA: A Cancer Journal for Clinicians. 2006;56:106–130. - PubMed
    1. Gorsky M, Epstein BJ, Oakley C, Le ND, Hay J, Stevenson-Moore P. Carcinoma of the tongue: a case series analysis of clinical presentation, risk factors, staging and outcome. Oral Surg Oral Med Oral Pathol Oral Radio Endod. 2004;98:546–52. - PubMed
    1. Shiboski CH, Schmidt BL, Jordan RCK. Tongue and tonsil carcinoma: increasing trends in the US population ages 20–44 years. Cancer. 2005;103:1843–9. - PubMed
    1. Sano D, Myers JN. Metastasis of squamous cell carcinoma of the oral tongue. Cancer Metastasis Rev. 2007;26:645–62. - PubMed

Publication types

MeSH terms

Substances