FEN1 functions in long patch base excision repair under conditions of oxidative stress in vertebrate cells
- PMID: 20145043
- PMCID: PMC2824787
- DOI: 10.1158/1541-7786.MCR-09-0253
FEN1 functions in long patch base excision repair under conditions of oxidative stress in vertebrate cells
Abstract
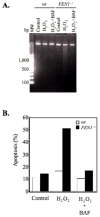
From in vitro studies, flap endonuclease 1 (FEN1) has been proposed to play a role in the long patch (LP) base excision repair (BER) subpathway. Yet the role of FEN1 in BER in the context of the living vertebrate cell has not been thoroughly explored. In the present study, we cloned a DT40 chicken cell line with a deletion in the FEN1 gene and found that these FEN1-deficient cells exhibited hypersensitivity to H(2)O(2). This oxidant produces genotoxic lesions that are repaired by BER, suggesting that the cells have a deficiency in BER affecting survival. In experiments with extracts from the isogenic FEN1 null and wild-type cell lines, the LP-BER activity of FEN1 null cells was deficient, whereas repair by the single-nucleotide BER subpathway was normal. Other consequences of the FEN1 deficiency were also evaluated. These results illustrate that FEN1 plays a role in LP-BER in higher eukaryotes, presumably by processing the flap-containing intermediates of BER.
Figures


Similar articles
-
Removal of oxidative DNA damage via FEN1-dependent long-patch base excision repair in human cell mitochondria.Mol Cell Biol. 2008 Aug;28(16):4975-87. doi: 10.1128/MCB.00457-08. Epub 2008 Jun 9. Mol Cell Biol. 2008. PMID: 18541666 Free PMC article.
-
FEN1 stimulation of DNA polymerase beta mediates an excision step in mammalian long patch base excision repair.J Biol Chem. 2000 Feb 11;275(6):4460-6. doi: 10.1074/jbc.275.6.4460. J Biol Chem. 2000. PMID: 10660619
-
Flap Endonuclease 1 Endonucleolytically Processes RNA to Resolve R-Loops through DNA Base Excision Repair.Genes (Basel). 2022 Dec 29;14(1):98. doi: 10.3390/genes14010098. Genes (Basel). 2022. PMID: 36672839 Free PMC article.
-
Flap endonuclease 1.Annu Rev Biochem. 2013;82:119-38. doi: 10.1146/annurev-biochem-072511-122603. Epub 2013 Feb 28. Annu Rev Biochem. 2013. PMID: 23451868 Free PMC article. Review.
-
DNA base excision repair: a mechanism of trinucleotide repeat expansion.Trends Biochem Sci. 2012 Apr;37(4):162-72. doi: 10.1016/j.tibs.2011.12.002. Epub 2012 Jan 27. Trends Biochem Sci. 2012. PMID: 22285516 Free PMC article. Review.
Cited by
-
A panel of colorimetric assays to measure enzymatic activity in the base excision DNA repair pathway.Nucleic Acids Res. 2019 Jun 20;47(11):e61. doi: 10.1093/nar/gkz171. Nucleic Acids Res. 2019. PMID: 30869144 Free PMC article.
-
Variant base excision repair proteins: contributors to genomic instability.Semin Cancer Biol. 2010 Oct;20(5):320-8. doi: 10.1016/j.semcancer.2010.10.010. Epub 2010 Oct 16. Semin Cancer Biol. 2010. PMID: 20955798 Free PMC article. Review.
-
HMGN1 protein regulates poly(ADP-ribose) polymerase-1 (PARP-1) self-PARylation in mouse fibroblasts.J Biol Chem. 2012 Aug 10;287(33):27648-58. doi: 10.1074/jbc.M112.370759. Epub 2012 Jun 26. J Biol Chem. 2012. PMID: 22736760 Free PMC article.
-
The nucleotide sequence, DNA damage location, and protein stoichiometry influence the base excision repair outcome at CAG/CTG repeats.Biochemistry. 2012 May 8;51(18):3919-32. doi: 10.1021/bi300410d. Epub 2012 Apr 23. Biochemistry. 2012. PMID: 22497302 Free PMC article.
-
FEN1 endonuclease as a therapeutic target for human cancers with defects in homologous recombination.Proc Natl Acad Sci U S A. 2020 Aug 11;117(32):19415-19424. doi: 10.1073/pnas.2009237117. Epub 2020 Jul 27. Proc Natl Acad Sci U S A. 2020. PMID: 32719125 Free PMC article.
References
-
- Friedberg EC, Walker GC, Siede W, Wood RD, Schultz RA, Ellenberger T. DNA Repair and Mutagenesis. 2. Washington, DC: ASM Press; 2006.
-
- Beard WA, Wilson SH. Structure and mechanism of DNA polymerase β. Chem Rev. 2006;106:361–82. - PubMed
-
- Meira LB, Burgis NE, Samson LD. Base excision repair. Adv Exp Med Biol. 2005;570:125–73. - PubMed
-
- Sobol RW, Prasad R, Evenski A, et al. The lyase activity of the DNA repair protein β-polymerase protects from DNA-damage-induced cytotoxicity. Nature. 2000;405:807–10. - PubMed
Publication types
MeSH terms
Substances
Grants and funding
- P42-ES05948/ES/NIEHS NIH HHS/United States
- P30 CA016086/CA/NCI NIH HHS/United States
- R01-CA084493/CA/NCI NIH HHS/United States
- Z01 ES050159/ImNIH/Intramural NIH HHS/United States
- R42 ES011746/ES/NIEHS NIH HHS/United States
- Z01 ES050158/ImNIH/Intramural NIH HHS/United States
- P30-CA16086/CA/NCI NIH HHS/United States
- R01 CA084493/CA/NCI NIH HHS/United States
- ES11746/ES/NIEHS NIH HHS/United States
- P30 ES010126/ES/NIEHS NIH HHS/United States
- P30-ES10126/ES/NIEHS NIH HHS/United States
- P42 ES005948/ES/NIEHS NIH HHS/United States
LinkOut - more resources
Full Text Sources
Molecular Biology Databases
Miscellaneous

