

High-risk neuroblastoma tumors with 11q-deletion display a poor prognostic, chromosome instability phenotype with later onset
- PMID: 20145112
- PMCID: PMC2840092
- DOI: 10.1073/pnas.0910684107
High-risk neuroblastoma tumors with 11q-deletion display a poor prognostic, chromosome instability phenotype with later onset
Abstract
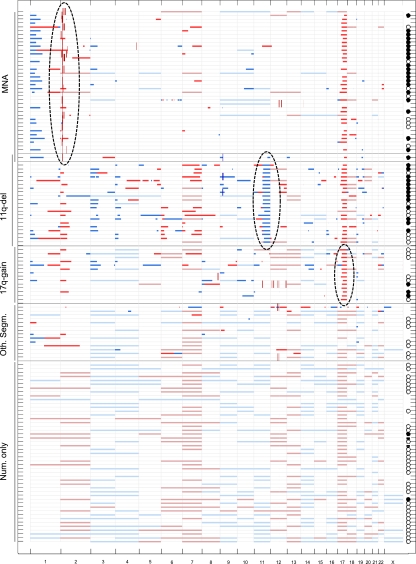
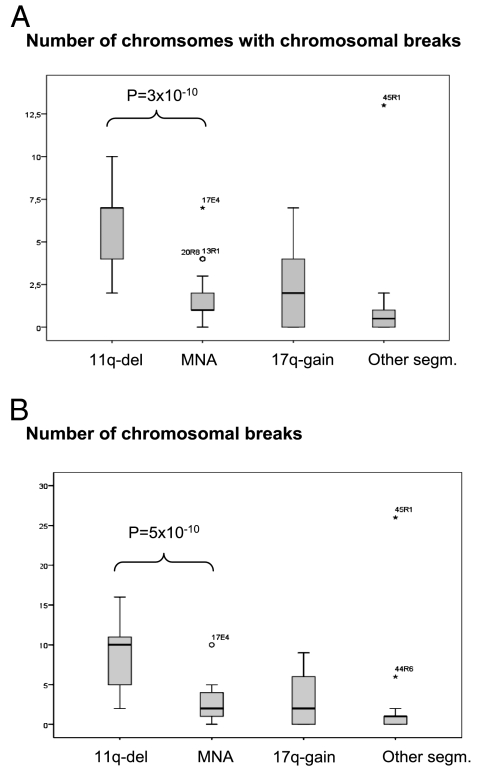
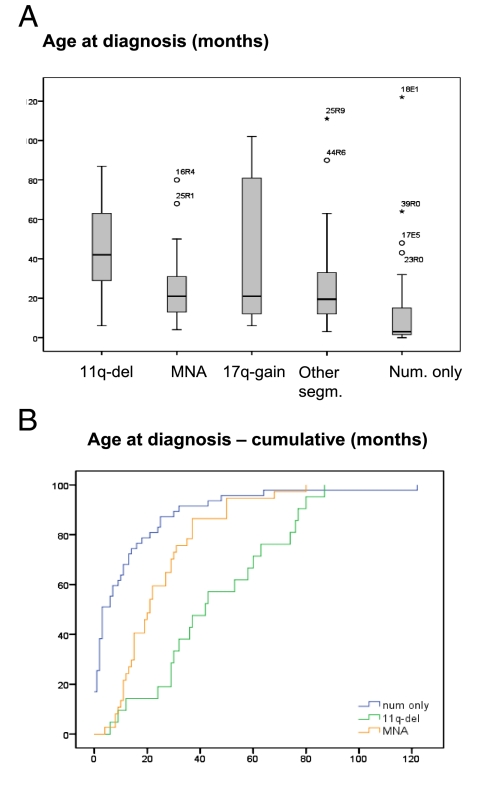
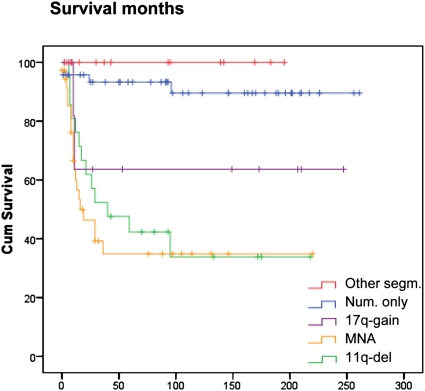
Analysis of chromosomal aberrations is used to determine the prognosis of neuroblastomas (NBs) and to aid treatment decisions. MYCN amplification (MNA) alone is an incomplete poor prognostic factor, and chromosome 11q status has recently been included in risk classification. We analyzed 165 NB tumors using high-density SNP microarrays and specifically compared the high-risk groups defined by MNA (n = 37) and 11q-deletion (n = 21). Median patient age at diagnosis was 21 months for MNA tumors and 42 months for 11q-deletion tumors, and median survival time after diagnosis was 16 months for MNA and 40 months for 11q deletion. Overall survival (at 8 years) was approximately 35% in both groups. MNA and 11q deletion were almost mutually exclusive; only one case harbored both aberrations. The numbers of segmental aberrations differed significantly; the MNA group had a median of four aberrations, whereas the 11q-deletion group had 12. The high frequency of chromosomal breaks in the 11q-deletion group is suggestive of a chromosomal instability phenotype gene located in 11q; one such gene, H2AFX, is located in 11q23.3 (within the 11q-deletion region). Furthermore, in the groups with segmental aberrations without MNA or 11q deletion, the tumors with 17q gain have worse prognosis than those with segmental aberrations without 17q gain, which have a favorable outcome. This study has implications for therapy in different risk groups and stresses that genome-wide microarray analyses should be included in clinical management to fully evaluate risk, aid diagnosis, and guide treatment.
Conflict of interest statement
The authors declare no conflict of interest.
Figures
References
-
- Spitz R, et al. Favorable outcome of triploid neuroblastomas: A contribution to the special oncogenesis of neuroblastoma. Cancer Genet Cytogenet. 2006;167:51–56. - PubMed
-
- Spitz R, et al. Oligonucleotide array–based comparative genomic hybridization (aCGH) of 90 neuroblastomas reveals aberration patterns closely associated with relapse pattern and outcome. Genes Chromosomes Cancer. 2006;45:1130–1142. - PubMed
-
- Brodeur GM. Neuroblastoma: Biological insights into a clinical enigma. Nat Rev Cancer. 2003;3:203–216. - PubMed
-
- Schwab M, Westermann F, Hero B, Berthold F. Neuroblastoma: Biology and molecular and chromosomal pathology. Lancet Oncol. 2003;4:472–480. - PubMed
Publication types
MeSH terms
Substances
LinkOut - more resources
Full Text Sources
Medical
Research Materials
Miscellaneous
