

Fitness flux and ubiquity of adaptive evolution
- PMID: 20145113
- PMCID: PMC2840135
- DOI: 10.1073/pnas.0907953107
Fitness flux and ubiquity of adaptive evolution
Abstract
Natural selection favors fitter variants in a population, but actual evolutionary processes may decrease fitness by mutations and genetic drift. How is the stochastic evolution of molecular biological systems shaped by natural selection? Here, we derive a theorem on the fitness flux in a population, defined as the selective effect of its genotype frequency changes. The fitness-flux theorem generalizes Fisher's fundamental theorem of natural selection to evolutionary processes including mutations, genetic drift, and time-dependent selection. It shows that a generic state of populations is adaptive evolution: there is a positive fitness flux resulting from a surplus of beneficial over deleterious changes. In particular, stationary nonequilibrium evolution processes are predicted to be adaptive. Under specific nonstationary conditions, notably during a decrease in population size, the average fitness flux can become negative. We show that these predictions are in accordance with experiments in bacteria and bacteriophages and with genomic data in Drosophila. Our analysis establishes fitness flux as a universal measure of adaptation in molecular evolution.
Conflict of interest statement
The authors declare no conflict of interest.
Figures
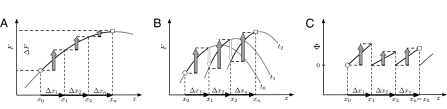
 (green lines), between initial and final population state in the interval (0, t) are shown as time series of an individual history (solid lines) and as ensemble averages over 105 independently evolving populations (dashed lines). Each population history obeys the detailed balance relation
  (in the equilibrium ensemble, log likelihood
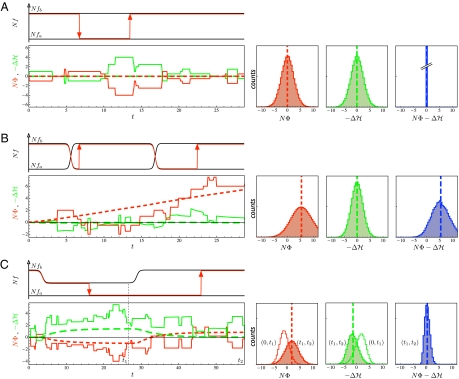
  equals scaled fitness NF). Evolutionary time is measured in units of the inverse neutral genomic mutation rate 1/μL. Polymorphism lifetimes are short, and substitution processes (vertical line segments and arrows) appear instantaneous on this time scale. For simulation details, see
  (green), and
  (blue) at a given time t = 28.8/μL for an ensemble of 105 populations, with averages marked by dashed vertical lines. (B) Nonequilibrium stationary state in a stochastic fitness seascape. Diagrams are the same as in A. Selection coefficients s(t) = fb(t) – fa(t) at individual genomic loci fluctuate between two values following a Poisson process, which generates independent selection histories at each locus (for details, see
  . (C) Transitions between equilibria under demographic changes. Diagrams are the same as in A. Population size first decreases from an initial value N0 to a bottleneck value Nb = N0/2, remains constant during the bottleneck, and later increases to the original value N0. This process results in time-dependent scaled-allele fitness values N(t)fa, N(t)fb and selection coefficients N(t)(fb – fa). The population decline generates a loss in scaled fitness, Δ1H = Δ1〈NF〉 < 0 and a negative scaled fitness flux N0〈Φ1〉 < 0 in the time interval (0, t1 = 26.6/μL). The recovery in the time interval (t1, t2 = 57.6/μL) restores the initial fitness, Δ2H = Δ2〈NF〉 = – Δ1H > 0, and generates a positive scaled fitness flux N0〈Φ2〉 that exceeds the flux N0〈Φ1〉 of the decline in magnitude (for details, see Methods and
 References
-
- Fisher RA. In: The Genetical Theory of Natural Selection: A Complete Variorum Edition. Bennet H, editor. Oxford, UK: Oxford University Press; 2000.
-
- Price GR. Selection and covariance. Nature. 1970;227:520–521. - PubMed
-
- Kimura M. On the change of population fitness by natural selection. Heredity. 1958;12:145–167.
-
- Iwasa Y. Free fitness that always increases in evolution. J Theor Biol. 1988;135:265–281. - PubMed
Publication types
MeSH terms
LinkOut - more resources
Full Text Sources
Molecular Biology Databases
